Example of the Text Explorer Platform
In this example, you want to explore the text responses from a survey about pets.
1. Select Help > Sample Data Library and open Pet Survey.jmp.
2. Select Analyze > Text Explorer.
3. Select Survey Response and click Text Columns.
4. From the Language list, select English.
5. Click OK.
Figure 12.2 Example of Initial Text Explorer Report
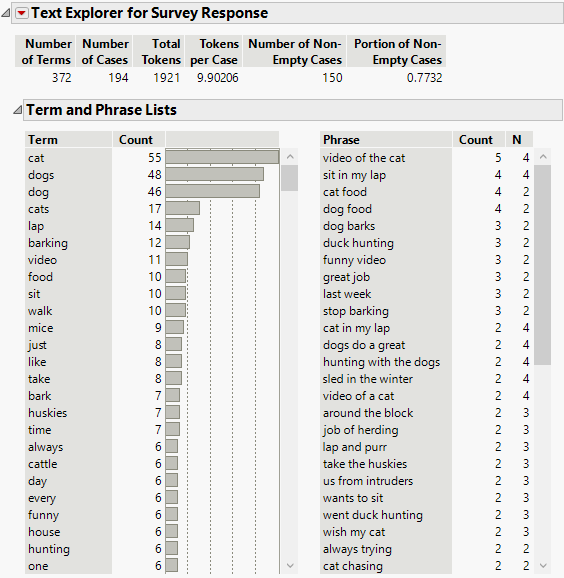
At a glance, you can see that there are 372 unique terms in 194 documents. In all, there are 1921 tokenized terms. The most common term is “cat”, and it occurs 55 times.
6. Click the red triangle next to Text Explorer for Survey Response and select Term Options > Stemming > Stem All Terms.
7. In the Phrase List table, select cat food and dog food, right-click the selection, and select Add Phrase.
The terms cat food and dog food are included in the Term List.
8. Scroll down in the Term List and find the cat and dog food entries.
You can see that there are four occurrences of each phrase.
Figure 12.3 Term List after Modifications and Scrolling
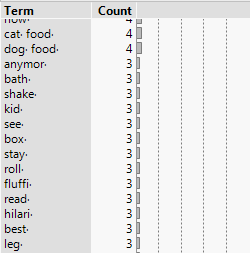
In the Phrase List, cat food and dog food are gray, since they are now locally being treated as terms in this Text Explorer report.
 The remaining steps of this example can be completed only in JMP Pro.
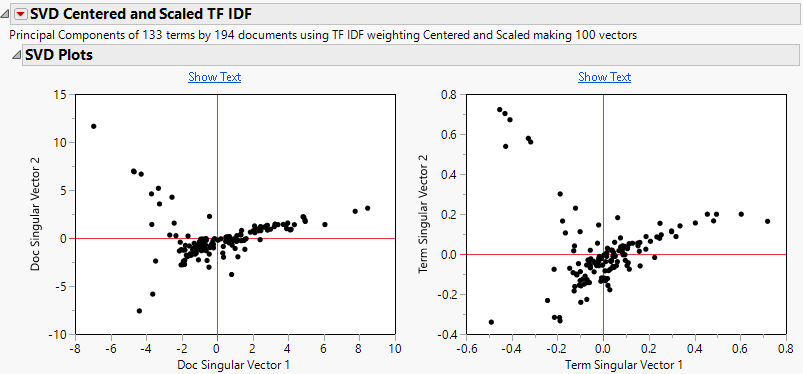
9.  Click the red triangle next to Text Explorer for Survey Response and select Latent Semantic Analysis, SVD.
10.  Click OK to accept the default values.
Two SVD Plots appear in the report. The one on the left shows the first two singular vectors in the document space. The one on the right shows the first two singular vectors in the term space.
Figure 12.4 SVD Plots
11.  Select the three right-most points in the left SVD Plot.
These three points represent survey responses that are clustered away from the rest of the points. To further investigate this cluster, you read the text of these responses.
12.  Click the Show Text button that is above the left SVD Plot.
Figure 12.5 Text of Selected Documents
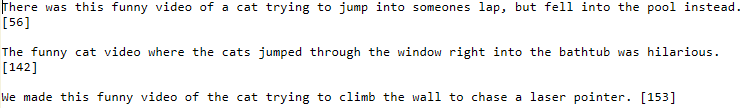
A window appears that contains the text of the three documents represented by the selected points. These survey responses are similar in that they all refer to some combination of “funny”, “cat”, and “video”. These documents have larger positive values for the first singular vector than the rest of the documents. These larger values indicate that they are different from the rest of the documents in that dimension.
Further investigation of the singular vector dimensions could lead to interpretations of what the dimensions represent. For example, many of the documents on the far right of the plot are responses that are about cats. On the far left, many of the responses are about dogs. Therefore, the first singular vector is picking up differences based on whether the response was about a cat or a dog.