Item Response Curves
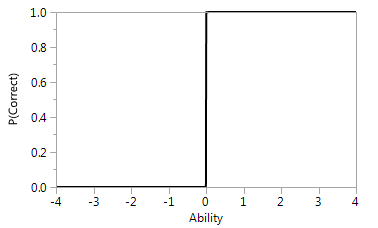
Item response curves (item characteristic curves) are used to describe the relationship between the ability, defined on an ability scale, and each item. An item response curve plots the probability of correctly answering an item against different levels of ability. An item with perfect discrimination has a 0% probability of correct answers for respondents with ability below a threshold and a 100% probability of a correct response for subjects with ability above the threshold.
Figure 11.8 Characteristic Curve for an Item with Perfect Discrimination
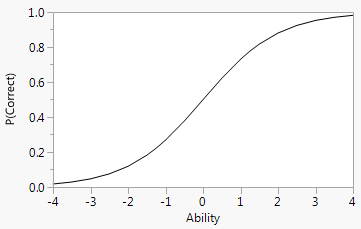
A typical relationship between the probability of correctly answering an item and ability is an S-shaped function with lower and upper asymptotes. As a respondent’s ability increases, their probability of correctly answering the item increases to 100%. The shape of the curve for a specific item is related to the difficulty and discriminatory properties of the item.
Figure 11.9 Typical Item Response Curve