 Latent Class Analysis
Latent class analysis enables you to group the documents from the corpus into clusters of similar documents. The Latent Class Analysis report contains the model specifications, the Bayesian Information Criterion (BIC) value for the model and a Show Text button. If one or more clusters in the Cluster Mixture Probabilities table is selected, the Show Text button opens a window that contains the text of the documents that are deemed most likely to belong to the selected cluster.
The Latent Class Analysis red triangle menu contains the following options:
Display Options
Specifies the contents of the Latent Class Analysis report. By default, all of the report options are shown except for the word clouds for each cluster.
Cluster Mixture Probabilities
Shows or hides a table of the probability of an observation belonging to each cluster.
Tip: You can select one or more rows in the Mixture Probabilities by Cluster table to select the observations assigned to the corresponding clusters.
Term Probabilities by Cluster
Shows or hides a table of terms with an estimate for each cluster of the conditional probability that a document contains the term, given that the document belongs to a particular cluster. By default, the terms in this table are sorted by descending frequency in the corpus.
The Cluster Most Characteristic column shows the cluster that the term occurs in at the highest rate.
The Cluster Most Probable column shows the cluster in which a randomly chosen document that contains the term is most likely to be found.
Top Terms by Cluster
Show or hides a table of the ten terms with the highest scores in each cluster. The score St,c for term t in cluster c is calculated as follows:
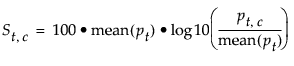
where mean(pt) is the mean of the term probabilities by cluster for term t and pt,c is the term probability by cluster for term t in cluster c.
MDS Plot
Shows or hides a multidimensional scaling plot, which is a two-dimensional representation of the proximity of the clusters. For more information about MDS plots, see Multidimensional Scaling in Multivariate Methods. The Show Text button opens a window that contains the text of the selected documents.
Cluster Probabilities by Row
Shows or hides the Mixture Probabilities table, which displays probabilities of cluster membership for each row. The Most Likely Cluster column indicates the cluster with the highest probability of membership for each row.
Word Clouds by Cluster
Shows or hides a matrix of word clouds, one for each cluster.
Rename Clusters
Enables you to add descriptive names for one or more of the clusters.
Save Probabilities
Saves the values in the Mixture Probabilities table to the corresponding rows in the data table.
Save Probability Formulas
Saves a formula column to the data table for each cluster as well as a formula column for the most likely cluster.
The score formula that is saved uses the Text Score() JSL function with the weighting argument set to “LCA”.
Color by Cluster
Colors each row in the data table according to its most likely cluster.
Remove
Removes the Latent Class Analysis report from the Text Explorer report.
For more information about latent class analysis, see Latent Class Analysis in Multivariate Methods.
Note: The LCA algorithm that is used in the Text Explorer platform takes advantage of the sparsity of the document term matrix. For this reason, the LCA results in the Text Explorer platform do not exactly match the results in the Latent Class Analysis platform.