Launch the Scatterplot Matrix Platform
Launch the Scatterplot Matrix platform by selecting Graph > Scatterplot Matrix.
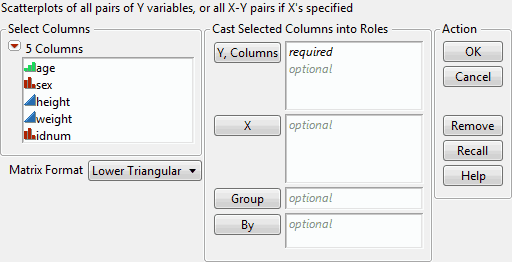
Figure 6.4 The Scatterplot Matrix Launch Window
Y, Columns, X
Specify columns for Y and X.
– If you assign variables to the Y, Columns role only, they appear on both the horizontal and vertical axes.
– If you assign variables to both the Y, Columns and X role, then the Y, Columns variables appear on the vertical axis. The X variables appear on the horizontal axis. This approach enables you to produce rectangular matrices, or matrices that have different, yet overlapping, sets of variables forming the axes of the matrix.
Group
If you assign a variable to the Group role, you can add shaded density ellipses for each level of the Group variable. See Example Using a Grouping Variable.
By
This option produces a separate scatterplot matrix for each level of the By variable. If two By variables are assigned, a separate graph for each possible combination of the levels of both By variables is produced.
Matrix Format
The Matrix Format can be one of three arrangements: Upper Triangular, Lower Triangular, or Square. See Change the Matrix Format.
After you click OK, the Scatterplot Matrix window appears. See The Scatterplot Matrix Window.
