 Model Launch Control Panel
When you click OK in the launch window, the Support Vector Machine report window appears, showing a Model Launch control panel for fitting models. Use the Model Launch control panel to specify the kernel function and associated parameter values, as well as the validation method.
Figure 9.5 The Model Launch Control Panel
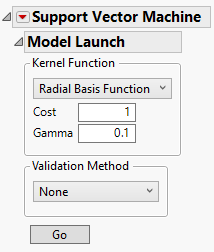
The Model Launch control panel contains the following options:
Kernel Function
Specifies the kernel function used in the model. Choose from the following kernel functions:
Radial Basis Function
Selects the radial basis function kernel to create a nonlinear hyperplane to separate the classes.
– The Cost parameter is the penalty associated with misclassifying an observation. A higher cost parameter implements an algorithm that is less likely to misclassify a point, whereas a lower cost parameter implements a more flexible algorithm. The Cost parameter must be greater than 0, and the default value is 1.
– The Gamma parameter is the parameter in the kernel function. This parameter determines the amount of curvature there is to the decision line; a higher Gamma value indicates more curvature. A nonlinear decision line provides a more flexible fit, but too much curvature can lead to overfitting. The Gamma parameter must be greater than 0, and the default value is 1/(# of predictors).
Linear
Selects the linear kernel function to create a linear hyperplane to separate the classes.
– The Cost parameter is the penalty associated with misclassifying an observation. A higher cost parameter implements an algorithm that is less likely to misclassify a point, whereas a lower cost parameter implements a more flexible algorithm. The Cost parameter must be greater than 0, and the default value is 1.
Note: If you specify parameter values that are out of range, the default values are used.
Tip: To find the best fitting model, fit a range of kernel functions and parameter values and use the Model Comparison report.
Validation Method
Specifies the model validation method. When you click the Go button for the first time, the first SVM model is fit using the specified validation method. This Validation Method is then used for all SVM models fit from within the SVM window. This ensures that all models in the report window are fit using the same validation method and validation set.
Holdback
Randomly divides the original data into training and validation sets. You can specify the proportion of the original data to use as the validation set (holdback).
KFold
(Available only when Y has exactly two levels.) Randomly divides the original data into K subsets. In turn, each of the K sets is used to validate the model fit on the rest of the data, fitting a total of K models. The model that has the best validation statistic is chosen as the final model.
Validation Column
(Available only if you specified a Validation column in the launch window.) Uses the values in the specified Validation column to divide the data into parts. The column’s values determine how the data are split, and what method is used for validation:
– If the column has three unique values, then:
the smallest value is used to designate the Training set.
the middle value is used to designate the Validation set.
the largest value is used to designate the Test set.
– If the column has two unique values, then only Training and Validation sets are used.
Validation Column K Fold
(Available only when the Y, Response column has exactly two levels and a Validation column is specified in the launch window.) Uses the values in the specified Validation column to divide the data into K sets, where K is the number of unique values in the column. Then, K-Fold validation is performed.
None
No validation used.
Go
Fits the specified SVM model and shows the model report.
Note: If you have a large data table, a progress bar is shown for each model that is fit to the data. The total number of models fit is k!/2(k-2)!, where k is the number of levels of the response variable. Each progress bar has an Accept Current Estimates button. Click this button if you want to stop the fitting algorithm early and accept the current estimates. Because prediction calculations are performed after you click this button, it may take some time for the report to appear.