Score Plot
The Score Plot displays a plot of principal components or partial least squares factors. Use the controls below the plot to change the components shown in the Score Plot.
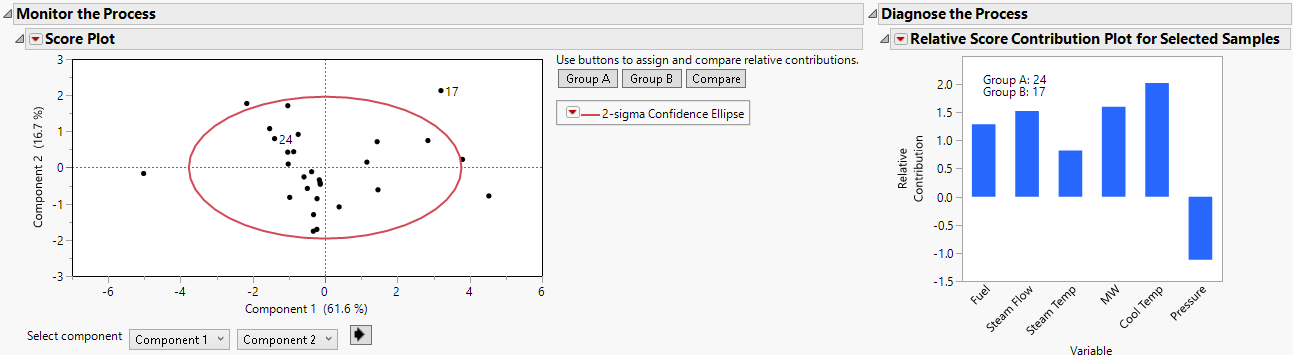
Use the buttons to the right of the plot to assign and compare the relative contributions between two groups of points. Relative contributions show how two or more samples differ from each other. Relative contributions show what changes in the underlying process variables contribute to differences in groups of samples. One use is to investigate the differences between an in-control sample and an out-of-control sample.
Group A is the reference group and Group B the comparator group. Each group can consist of one or more points. To assign the reference group, select one or more points and then click Group A. To assign the comparator group, select one or more points and then click Group B. To display the Relative Score Contribution Plot, click Compare.
Figure 11.8 Score Plot with Relative Contribution Plot for Row 17 Relative to Row 24