Statistical Details for the ALT Design Platform
In the ALT design platform, you can select either a lognormal or Weibull failure distribution.
This section contains the parameterizations for the probability density function (pdf) and cumulative distribution function (cdf) for each distribution. For more information about the Weibull distribution, see Life Distribution in Reliability and Survival Methods.
Lognormal
Lognormal distributions are used commonly for failure times when the range of the data is several powers of 10. This distribution is often conceptualized as the multiplicative product of many small positive independently and identically distributed random variables. This distribution is appropriate when the logarithms of the data values appear normally distributed. The probability distribution function is usually characterized by strong right-skewness.
The lognormal family is parameterized by a location parameter, μ, and a shape parameter, σ. The lognormal pdf and cdf are given as follows, where the logarithm is to the base e:
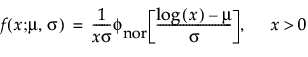
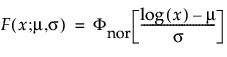 ,
,
The functions
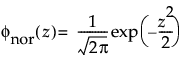
and
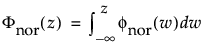
are the pdf and cdf, respectively, for the standard normal distribution (N(0,1)).
Weibull
The Weibull distribution can be used to model failure time data with either an increasing or a decreasing hazard rate. It is used frequently in reliability analysis because of its tremendous flexibility in modeling many different types of data, based on the values of the shape parameter.
The Weibull pdf and cdf are commonly represented as follows:
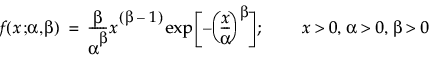
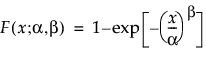
where α is a scale parameter, and β is a shape parameter. The Weibull distribution reduces to an exponential distribution when β = 1.
Weibull Parameterization
In JMP, the Weibull parameterization defines σ as the scale parameter and μ as the location parameter. These are related to the α and β Weibull parameterization as follows:

and

With these parameters, the pdf and the cdf of the Weibull distribution are expressed as a log-transformed smallest extreme value distribution (SEV) using a location-scale parameterization with μ = log(α) and σ = 1/β:
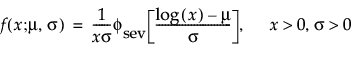
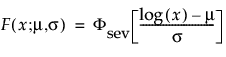
where
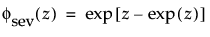
and
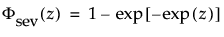
are the pdf and cdf, respectively, for the standardized smallest extreme value (μ = 0, σ = 1) distribution.
R Precision Factor (95% CI)
The R precision factor is a Wald confidence interval for a positive quantity t: