Publication date: 04/28/2021
Statistical Details for Weighted Moving Average Charts
Control Limits for UWMA Charts
Control limits for UWMA charts are computed for each subgroup i as follows.
LCLi = 
UCLi = 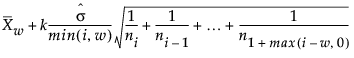
where:
w is the span parameter (number of terms in moving average)
ni is the sample size of the ith subgroup
k is the number of standard deviations
 is the weighted average of subgroup means
 is the estimated process standard deviation
Control Limits for EWMA Charts
Control limits for EWMA charts are computed as follows:
LCL = 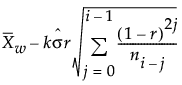
UCL = 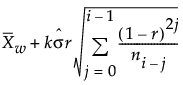
where:
r is the EWMA weight parameter (0 < r ≤ 1)
xij is the jth measurement in the ith subgroup, with j = 1, 2, 3,..., ni
ni is the sample size of the ith subgroup
k is the number of standard deviations
 is the weighted average of subgroup means
 is the estimated process standard deviation
Want more information? Have questions? Get answers in the JMP User Community (community.jmp.com).