Publication date: 04/28/2021
T2 Plot
The T2 value for the ith observation is computed as follows:
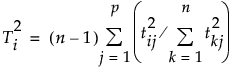
where tij = X score for the ith row and jth extracted factor, p = number of extracted factors, and n = number of observations used to train the model. If validation is not used, n = total number of observations.
The control limit for the T2 Plot is computed as follows:
((n-1)2/n)*BetaQuantile(0.95, p/2, (n-p-1)/2)
where p = number of extracted factors, and n = number of observations used to train the model. If validation is not used, n = total number of observations. See Tracy et al. (1992).
Want more information? Have questions? Get answers in the JMP User Community (community.jmp.com).