The Multiple Correspondence Analysis Report
The initial Multiple Correspondence Analysis report shows the variable summary, correspondence analysis plot, and details of the dimensions of the data in order of importance. From the plot of the cloud of categories or individuals, you can identify associations that exist within the data. The details provide information about whether the two dimensions shown in the plot are sufficient to understand the relationships within the table.
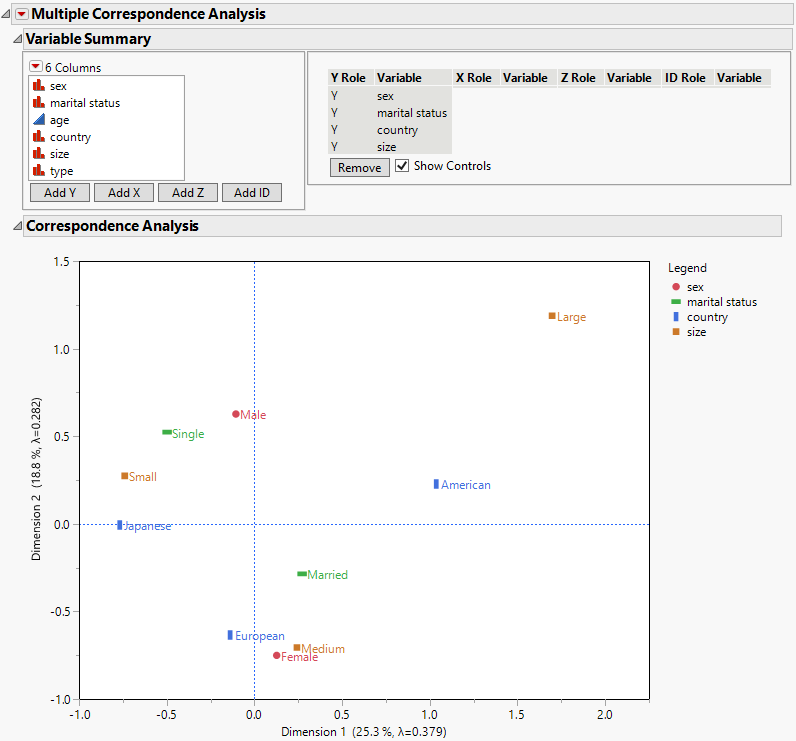
The Variable Summary shows the columns used in the analysis and the roles that you selected in the launch window. If you select the Show Controls check box, a list of the columns in the data table appears to the left. You can change the columns in the analysis either by selecting a column and clicking Add Y, Add X, Add Z, or Add ID. Or you can drag the column to the header in the variable summary table. This enables you to modify the analysis without returning to the launch window.
Figure 7.5 Multiple Correspondence Analysis Report with Show Controls Selected