The Prediction Profiler
The report contains a prediction profiler.
1. From the prediction profiler you can see how the crossed effects show as curvature in the prediction traces. As you change values of one component (drag the red lines) the values of the other two components move in the opposite direction to maintain their ratio and the overall mixture constraint (components must sum to 100%).
Note: The axes of prediction profiler traces range from the defined upper and lower bounds of the factors, p1, p2, and p3. When you explore the effect of a component and the limit of a second component is reached, it cannot move further and only the third variable changes to maintain the mixture constraint.
2. To the visible profile curves to bounds that take into account the levels of all three components, click the Prediction Profiler red triangle and select Profile at Boundary > Stop at Boundaries.
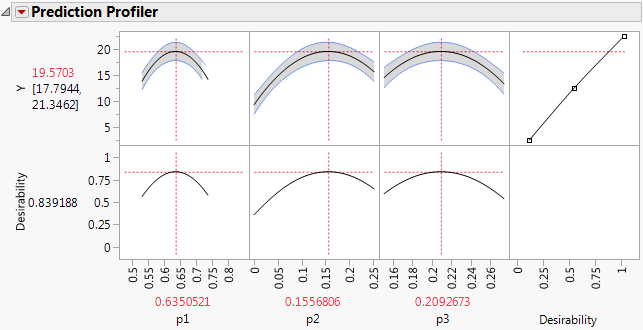
3. To optimize the mixture components click the Prediction Profiler red triangle and select Optimization and Desirability > Desirability Functions.
4. Click the Prediction Profiler red triangle and select Optimization and Desirability > Maximize Desirability to obtain the optimal factor settings for maximum Y.
The profiler displays optimal settings (rounded) of 0.6350 for p1, 0.1557 for p2, and 0.2093 for p3, which give an estimated response of 19.5703.
Figure 13.25 Maximum Desirability in Profiler for Mixture Analysis Example