V-Mask CUSUM Chart Example
A machine fills 8-ounce cans of two-cycle engine oil additive. The filling process is believed to be in statistical control. The process is set so that the average weight of a filled can (μ0) is 8.10 ounces. Previous analysis shows that the standard deviation of fill weights (σ0) is 0.05 ounces.
Subgroup samples of four cans are selected and weighed every hour for twelve hours. Each observation in the Oil1 Cusum.jmp data table contains one value of weight and its associated value of hour. The observations are sorted so that the values of hour are in increasing order.
1. Select Help > Sample Data Library and open Quality Control/Oil1 Cusum.jmp.
2. Select Analyze > Quality And Process > Legacy Control Charts > CUSUM.
3. Select weight and click Process.
4. Select hour and click Sample Label.
5. Select the Two Sided check box if it is not already checked.
6. In the Parameters area, click the H button and type 2.
7. Click Specify Stats.
8. Type 8.1 next to Target.
8.1 is the average weight in ounces of a filled can. This is the target mean.
9. Type 1 next to Delta.
1 is the absolute value of the smallest shift to be detected as a multiple of the process standard deviation or of the standard error.
10. Type 0.05 next to Sigma.
0.05 is the known standard deviation of fill weights (σ0) in ounces.
Figure 12.27 Completed Launch Window
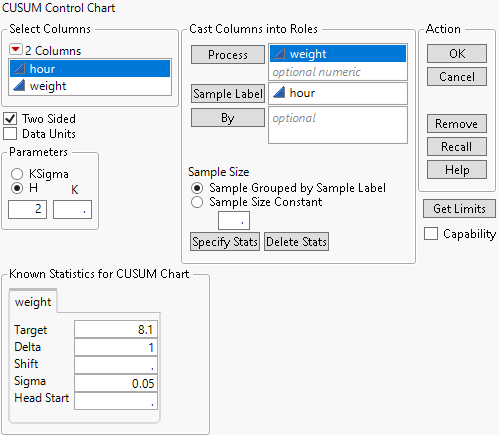
11. Click OK.
Figure 12.28 Two-Sided CUSUM Chart for Oil1 Cusum.jmp Data
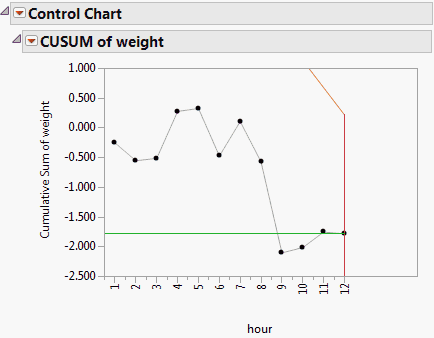
You can interpret the chart by comparing the points with the V-mask. The right edge of the V-mask is centered at the most recent point (the 12th hour). Because none of the points cross the arms of the V-mask, there is no evidence that a shift in the process has occurred. See V-Mask CUSUM Chart Reports.