Add Images from Data Tables to Hover Labels
You can add images to hover labels using graphlets, but you can also add them from a data table.
Tip: For details about adding JMP graphs or images using graphlets in a hover label, see Customize Hover Labels.
1. Create a new column in your data table.
2. Right-click the column, select Column Info, and select the Expression data type.
3. Click OK.
4. Drag graphics from your computer into each cell of the column. You can also import data that contains a column of images.
5. Right-click the column in the data table and select Label/Unlabel to apply a label.
6. Create a graph using your data table (for example, in Graph Builder or Distribution).
7. Place your pointer over a data point or a histogram bar.
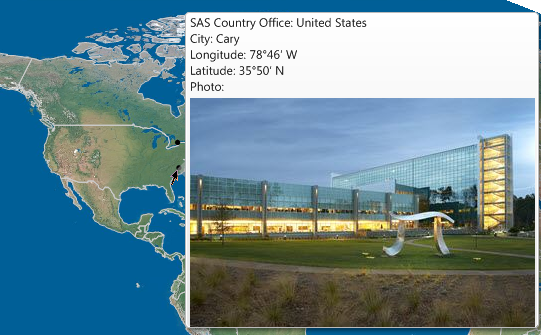
The image appears on the label. To see an example, run the Graph Builder script in the SAS Offices.jmp sample data table.
Figure 9.69 Image on Hover Label
Tips:
• Images in an expression column can also be used as markers. See Use Images as Markers.
• You can pin the hover label so that the label always appears on the graph. See Pin Hover Labels on a Graph.