Change Marker Shape or Colors Based On Values
In some plots, you can change marker shapes or colors based on the values of points by adding a row legend. It is called a row legend because JMP automatically inserts a legend using row color or row marker settings. When you assign markers or colors in this way, it assigns the characteristic(s) to all points in a graph, regardless of what points you have selected. All previous marker and color settings are overwritten.
To add shapes or colors based on column values, follow these steps:
1. Right-click anywhere in a graph. In a histogram, right-click the box plot area on the right.
2. Select Row Legend.
3. In the window that appears, highlight the column whose values you want to color or mark. A preview of the legend is shown on the right.
Figure 9.24 Adding a Row Legend
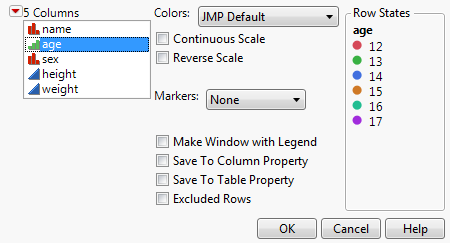
4. Refine your row legend using the following options:
Colors
Lets you choose among several pre-defined color schemes.
Tip: If you already applied a color scheme in the data table, select None to maintain it. Colors should be consistently applied and uniquely grouped.
Continuous Scale
Assigns colors on a spectrum that corresponds to the ascending or descending order of the values. Use this option when the highlighted column contains continuous values.
Reverse Scale
Reverses the scale of colors.
Markers
Lets you choose among several marker schemes.
Tip: If you already applied a marker scheme in the data table, select None to maintain it. Markers should be consistently applied and uniquely grouped.
Make Window with Legend
Creates a separate legend window that tells you what colors and shapes correspond to which value.
Save to Column Property
Adds a column property that stores the selected color theme.
Save to Table Property
Adds a table property that preserves the selected color and marker configuration.
Excluded Rows
Assigns colors or markers to rows that are excluded.
Most legends have one column. However, the following platforms have multi-column legends when there are more than 20 levels:
• Recurrence
• Oneway (for CDF Plot and all three Densities red triangle commands)
• Fit Model (for the Regression Plot in Standard Least Squares)
• Survival
Remove the Row Legend
Delete a row legend by right-clicking it and selecting Remove.