Control Limits for G Charts
The negative binomial distribution is an extension of the geometric (Poisson) distribution and allows for over-dispersion relative to the Poisson. The negative binomial distribution can be used to construct both exact and approximate control limits for count data. Approximate control limits can be obtained based on a chi-square approximation to the negative binomial. All data is used as individual observations regardless of subgroup size.
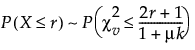
Let X have a negative binomial distribution with parameters (μ, k). Then:
where:
 is a chi-square variate with v = 2μ/(1+μk) degrees of freedom.
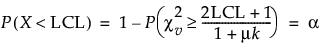
Based on this approximation, approximate upper and lower control limits can be determined. For a nominal level α Type 1 error probability in one direction, an approximate upper control limit is a limit UCL such that:

Likewise, an approximate lower control limit, LCL, is a limit such that:
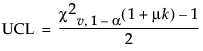
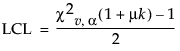
Thus, an approximate level lower and upper control limits, LCL and UCL, respectively, are computed as:
where:
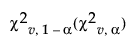 is the upper (lower) percentile of the chi-square distribution with v = 2μ/(1+μk) degrees of freedom. Negative lower control limits can be set to zero.
For more information about the negative binomial control limits, see Hoffman (2003).