Create and Assess the Optimal Design
Click Make Design to create the optimal design and see results that address the quality of the design. By default, the optimal design is D-optimal. You can change the optimality criterion by selecting the red triangle option ALT Optimality Criterion.
When you click Make Design, the following report appears:
Figure 22.20 Design Outlines
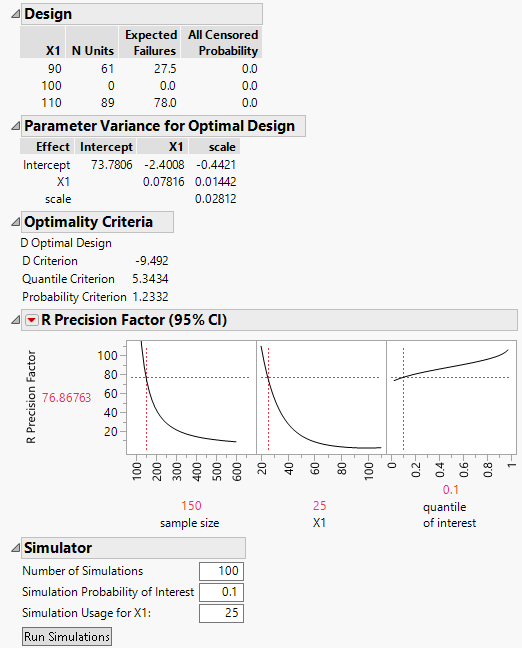
Design
Shows the number of units to be tested at each combination of acceleration levels. For a single factor, the first column gives the levels of the factor. For two factors, the first two columns give the levels of the factors.
N Units
The number of units to be tested at each combination of acceleration levels.
Expected Failures
Expected number of failures for the design setting. The expected number is computed using the prior model specification.
All Censored Probability
Probability that none of the units tested at the combination of acceleration levels fail. The probability is computed using the prior model specification.
Note: The expected failures and censoring probabilities enable you to judge whether your prior specifications are reasonable.
Parameter Variance for Optimal Design
Shows a matrix proportional to the covariance matrix for the estimates of the acceleration model parameters for the optimal design. The calculation assumes that the values specified in the Prior Mean outline are the true parameter values. See Parameter Variance for Balanced Design.
Note: Compare the values in the Parameter Variance for Optimal Design matrix to those in the Parameter Variance for Balanced Design matrix to determine the extent to which the optimal design reduces the variance of estimates.
Optimality Criteria
Values for three optimality criteria appear:
D Criterion
D-optimality of the design. See Make D-Optimal Design.
Quantile Criterion
Time I-optimality of the design. See Make Quantile Estimate Optimal.
Probability Criterion
Probability I-optimality of the design. See Make Failure Probability Optimal.
R Precision Factor (95% CI)
A profiler to evaluate the impact of sample size, level of the factor(s), and the quantile of interest on the R Precision Factor. The R Precision Factor (95% CI) reflects the confidence interval for the quantile of interest.
Simulator
Use the simulator to explore your accelerated model before collecting data.
Number of Simulations
The number of simulation trials to run.
Simulation Probability of Interest
The failure probability of interest.
Simulation Usage
Values for the usage conditions of the acceleration factors.
After clicking Run Simulations, a table of summary statistics and a plot of model fits appear.