Examine Student Measurements
The following example uses the Big Class.jmp sample data table, which contains data on age, sex, height, and weight for 40 students. Examine the relationships between different variables.
1. Select Help > Sample Data Library and open Big Class.jmp.
2. Select Graph > Parallel Plot.
3. Select height and weight and click Y, Response.
4. Select age and click X, Grouping.
5. Select sex and click By.
6. Select the Scale Uniformly check box.
7. Click OK.
Figure 7.12 Height and Weight by Sex, Grouped by Age
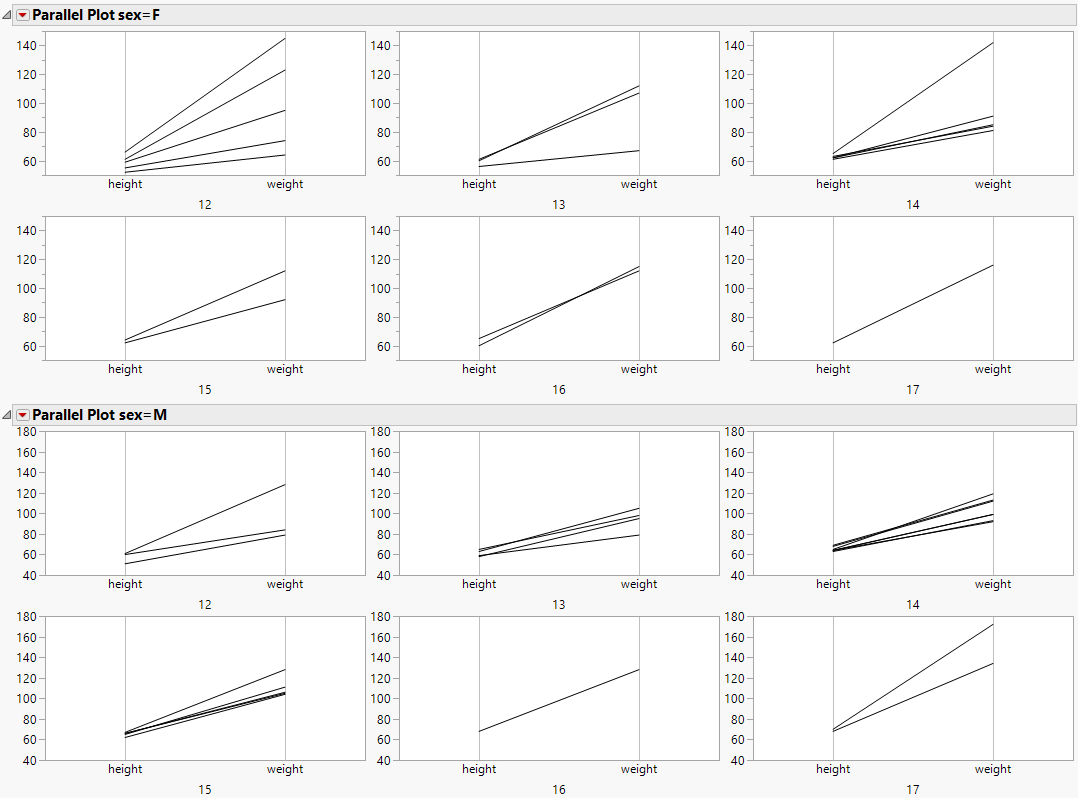
You observe the following:
• Among the 13-year-old females, one female’s weight is lower than the other females in her age group. If you click the line representing the lower weight, the respective individual (Susan) is highlighted in the data table.
• Among the 14-year-old females, one female’s weight is higher than the other females in her age group. If you click the line representing the higher weight, the respective individual (Leslie) is highlighted in the data table.