Examine the Same Distribution across Groups
Suppose you want to compare the same distribution across different groups. You want to examine estimates of failure probabilities for a single type of capacitor operating at three different temperatures.
1. Select Help > Sample Data Library and open Reliability/Capacitor ALT.jmp.
2. Select Analyze > Reliability and Survival > Life Distribution.
3. Click the Compare Groups tab.
4. Select Hours and click Y, Time to Event.
5. Select Temperature and click Grouping.
6. Select Censor and click Censor.
7. Select Freq and click Freq.
8. Click OK.
Figure 3.16 Compare Distribution for Groups
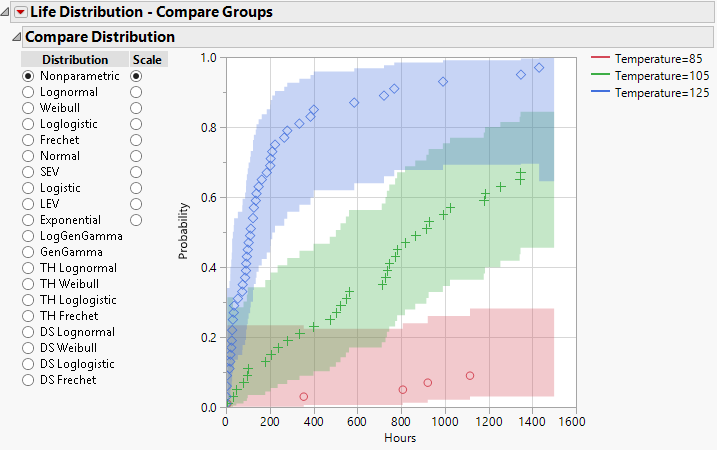
The default graph shows the nonparametric estimates. At a higher temperature, the capacitor has a higher probability of failure. You want to try fitting a parametric distribution.
9. Select Weibull for Distribution and Scale.
Figure 3.17 Compare Weibull Distribution for Groups
When plotted against a Weibull probability scale, the points come close to following three lines. This indicates that a Weibull distribution provides a reasonable fit for each of the Temperature groups.