Example of a Canonical 3D Plot
1. Select Help > Sample Data Library and open Owl Diet.jmp.
2. Select rows 180 through 294.
These are the rows for which species is missing. Hide and exclude these rows.
3. Select Rows > Hide and Exclude.
4. Select Rows > Color or Mark by Column.
5. Select species.
6. From the Colors menu, select JMP Dark.
7. Check Make Window with Legend.
8. Click OK.
A small Legend window appears. The rows in the data table are assigned colors by species.
9. Select Analyze > Multivariate Methods > Discriminant.
10. Specify skull length, teeth row, palatine foramen, and jaw length as Y, Covariates.
11. Specify species as X, Categories.
12. Click OK.
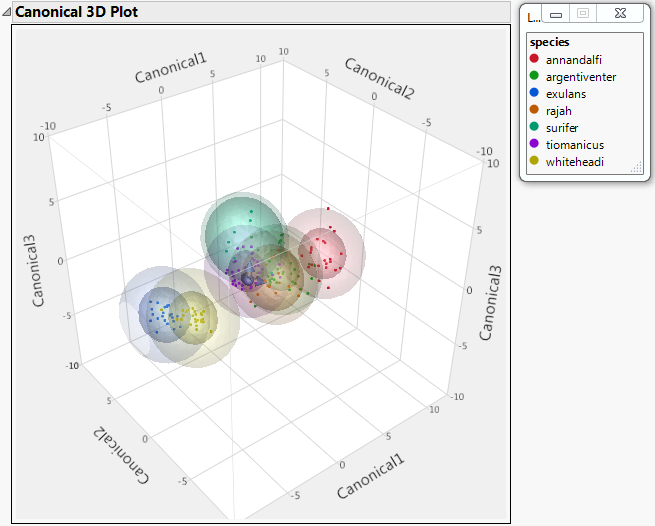
13. Click the Discriminant Analysis red triangle and click Canonical 3D Plot.
Tip: Click categories in the Legend to highlight those points in the Canonical 3D plot. Click and drag inside the 3D plot to rotate it.
Figure 5.15 Canonical 3D Plot with Legend Window