Example of a Continuous Response
In this example, you use the Partition platform to construct a decision tree that predicts the one-year disease progression measured on a quantitative scale for patients with diabetes.
1. Select Help > Sample Data Library and Diabetes.jmp.
2. Select Analyze > Predictive Modeling > Partition.
3. Select Y and click Y, Response.
4. Select Age through Glucose and click X, Factor.
5. Select a validation procedure based on your JMP installation:
– For JMP Pro, select Validation and click Validation.
– For JMP, enter 0.3 as the Validation Portion.
Note: Results using the validation proportion can differ from those shown here due to the random selection of validation rows.
Figure 4.20 Completed Launch Window with Validation Portion = 0.3
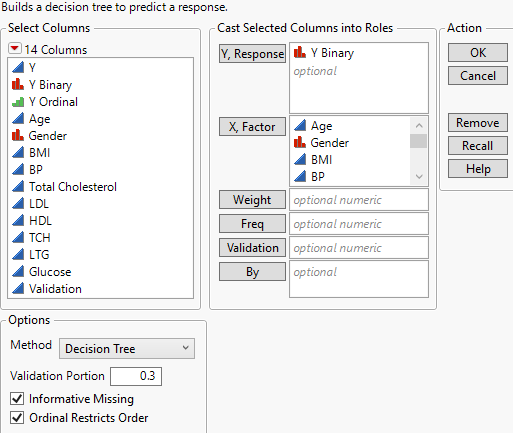
6. Click OK.
7. On the platform report window, click Split once to perform a split.
Figure 4.21 Report after First Split with Decision Tree Hidden
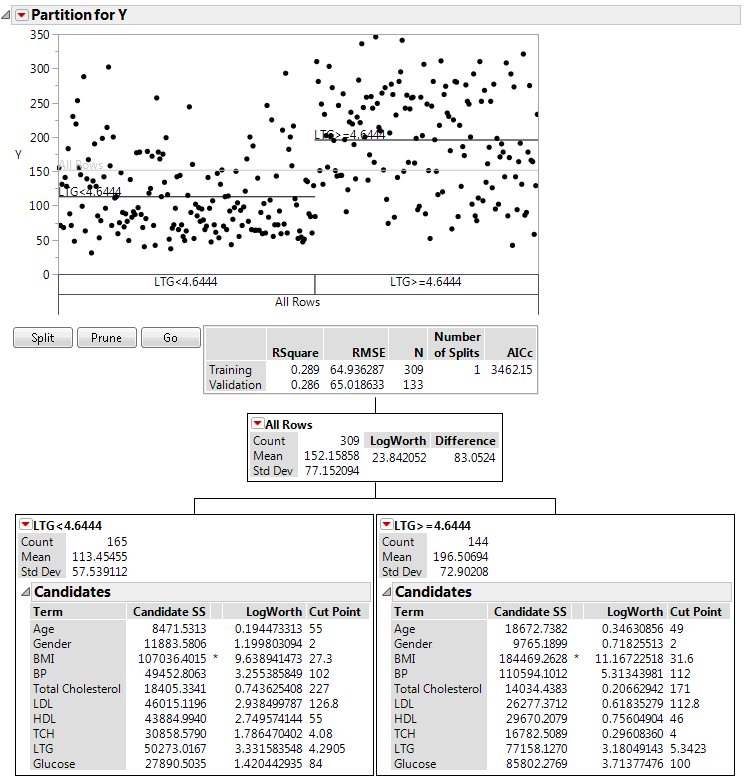
The original 309 values in the training data set are now split into two parts:
– The left leaf, corresponding to LTG < 4.6444, has 165 observations.
– The right leaf, corresponding to LTG >= 4.6444 has 144 observations.
For both the right and left leaf the next split would be on BMI. The Candidate SS for BMI on the right leaf is higher than the Candidate SS for BMI on the left leaf. Thus, the next split is on the right leaf.
8. Click Go to use automatic splitting.
Figure 4.22 Report after Automatic Splitting with Validation
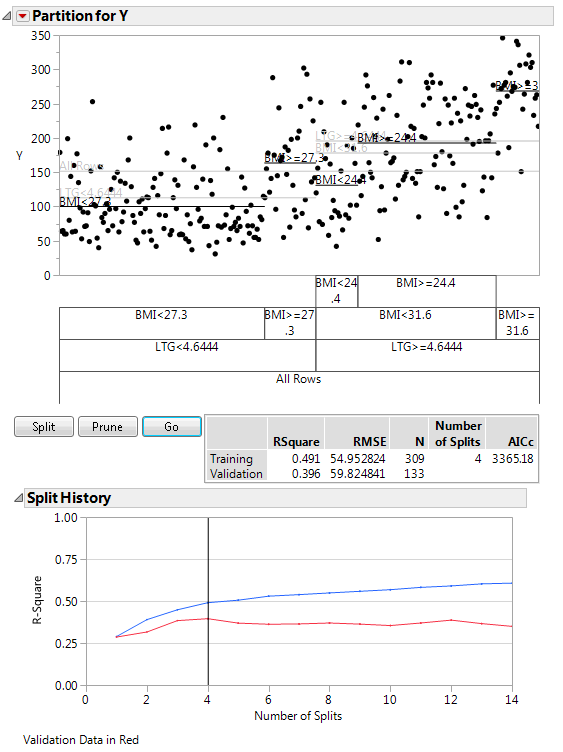
The solution found has four splits. The Split History plot shows that there is no further improvement in the validation data set after four splits. The RSquare value of 0.39 on the validation data does not support this model as a strong predictor of disease progression. The scatter across partitions in the partition plot further indicate that this model does not separate the Y levels well.