Example of a Neural Network
This example uses the Boston Housing.jmp data table. Suppose you want to create a model to predict the median home value as a function of several demographic characteristics. Follow the steps below to build the neural network model:
1. Select Help > Sample Data Library and Boston Housing.jmp.
2. Launch the Neural platform by selecting Analyze > Predictive Modeling > Neural.
3. Assign mvalue to the Y, Response role.
4. Assign the other columns (crim through lstat) to the X, Factor role.
5. Click OK.
6. Enter 0.2 for the Holdback Proportion.
7. Enter 1234 for the Random Seed.
Note: In general, results vary due to the random nature of choosing a validation set. Entering the seed above enable you to reproduce the results shown in this example.
8. Enter 3 for the number of TanH nodes in the first layer.
9. Check the Transform Covariates option.
10. Click Go.
Figure 3.6 Neural Report
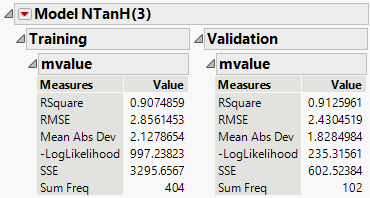
Results are provided for both the training and validation sets. Use the results of the validation set as a representation of the model’s predictive power on future observations.
The R-Square statistic for the Validation set is 0.913, signifying that the model is predicting well on data not used to train the model. As an additional assessment of model fit, click the red triangle next to Model NTanH(3) and select Plot Actual by Predicted.
Figure 3.7 Actual by Predicted Plot
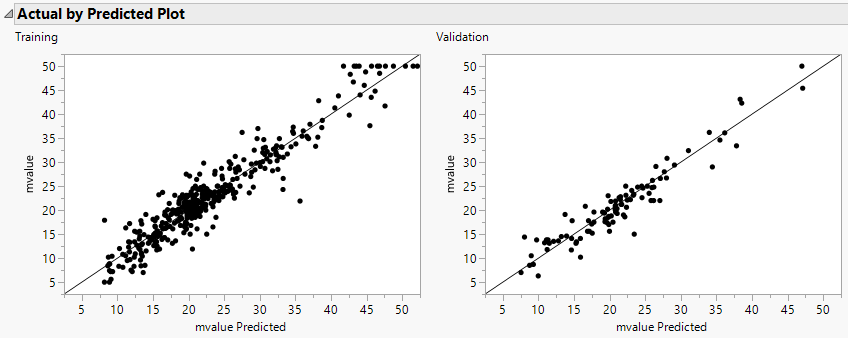
The points fall along the line, signifying that the predicted values are similar to the actual values.
To get a general understanding of how the X variables are impacting the predicted values, click the red triangle next to Model NTanH(3) and select Profiler.
Figure 3.8 Profiler
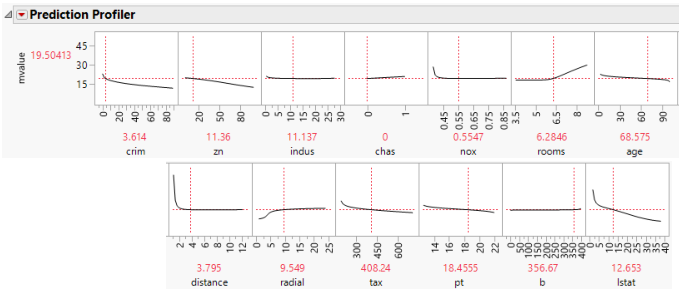
Some of the variables have profiles with positive slopes, and some negative. For example, the variable rooms has a positive slope. This indicates that the more rooms a home has, the higher the predicted median value. The variable pt is the pupil teacher ratio by town. This variable has a negative slope, indicating that the higher the pupil to teacher ratio, the lower the median value.