Publication date: 04/30/2021
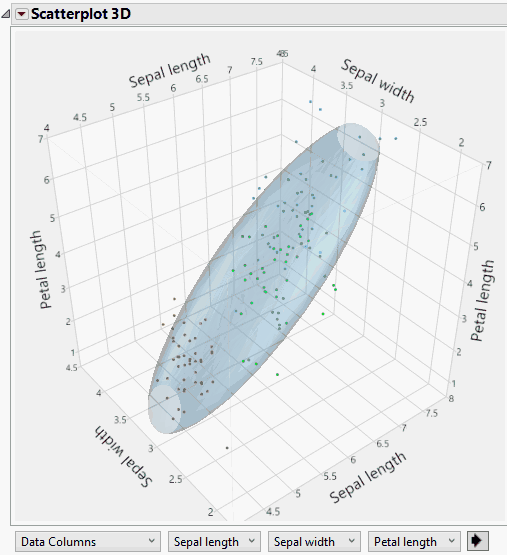
Example of an Ungrouped Normal Contour Ellipsoid
This example shows how to add a normal contour ellipsoid to more than 75% of the data points. The ellipsoid is 25% transparent.
1. Select Help > Sample Data Library and open Iris.jmp.
2. Select Graph > Scatterplot 3D.
3. Select Sepal length, Sepal width, Petal length, and Petal width and click Y, Columns.
4. Click OK.
5. Click the Scatterplot 3D red triangle and select Normal Contour Ellipsoids. Notice that Ungrouped is already selected.
6. Type 0.75 next to Coverage.
7. Type 0.25 next to Transparency.
8. Click OK.
Figure 9.8 Example of an Ungrouped Normal Contour Ellipsoid
Want more information? Have questions? Get answers in the JMP User Community (community.jmp.com).