 Example of Bootstrap Forest with a Categorical Response
In this example, you construct a bootstrap forest model to predict whether a customer is a bad credit risk. But you are aware that your data set contains missing values, so you also explore the degree to which values are missing.
 Bootstrap Forest Model
1. Select Help > Sample Data Library and open Equity.jmp.
2. Select Analyze > Predictive Modeling > Bootstrap Forest.
3. Select BAD and click Y, Response.
4. Select LOAN through DEBTINC and click X, Factor.
5. Select Validation and click Validation.
6. Click OK.
7. Next to Maximum Splits per Tree, enter 30.
8. Select Multiple Fits over Number of Terms and enter 5 next to Max Number of Terms.
9. (Optional) Select Suppress Multithreading and enter 123 next to Random Seed.
Because the bootstrap forest method involves random sampling, these actions ensure that your results are exactly the same as the results shown below.
10. Click OK.
Figure 5.2 Overall Statistics Report
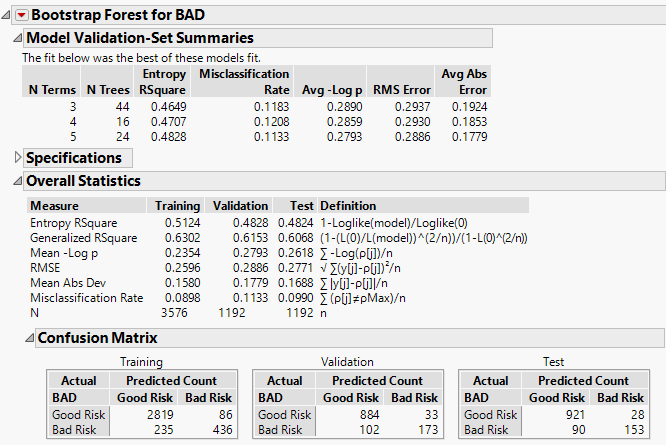
Because the Multiple Fits over Number of Terms option was specified, models were created using 3, 4, and 5 as the number of predictors in each split. The Model Validation-Set Summaries report shows that the model whose Validation set has the highest Entropy RSquare is the five-term model. This is also the model with the smallest misclassification rate. This model is determined to be the best model, and the results in the Overall report are for this model.
The Overall report shows that the misclassification rates for the Validation and Test sets are about 11.3% and 9.9%, respectively. The confusion matrices suggest that the largest source of misclassification is the classification of bad risk customers as good risks.
The results for the Test set give you an indication of how well your model extends to independent observations. The Validation set was used in selecting the Bootstrap Forest model. For this reason, the results for the Validation set give a biased indication of how the model generalizes to independent data.
You are interested in determining which predictors contributed the most to your model.
11. Click the red triangle next to Bootstrap Forest for BAD and select Column Contributions.
Figure 5.3 Column Contributions Report
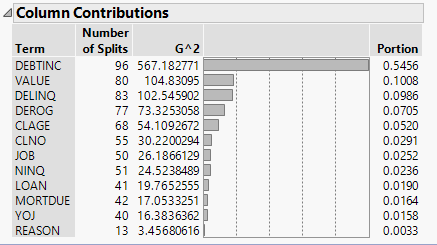
The Column Contributions report suggests that the strongest predictor of a customer’s credit risk is DEBTINC, which is the debt to income ratio. The next highest contributors to the model are DELINQ, the number of delinquent credit lines, and VALUE, the assessed value of the customer.
 Missing Values
Next, you explore the extent to which predictor values are missing.
1. Select Analyze > Screening > Explore Missing Values.
2. Select Bad through DEBTINC and click Y, Columns.
3. Click OK in the Alert that appears.
The columns REASON and JOB are not added to the Y, Columns list because they have a Character data type. You can see how many values are missing for these two columns using Distribution (not illustrated in this example).
4. Click OK.
Figure 5.4 Missing Values Report
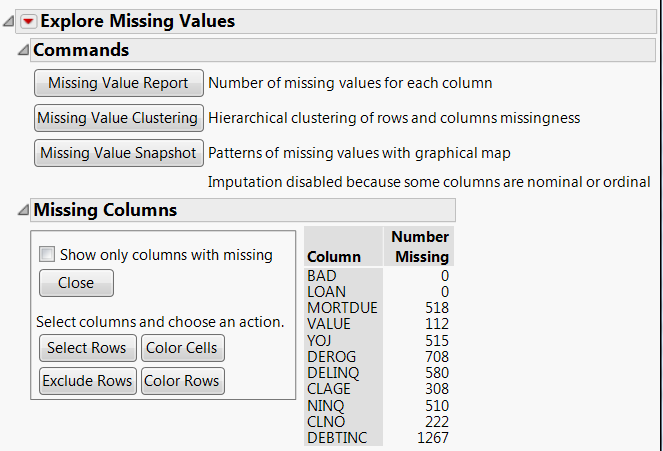
The DEBTINC column contains 1267 missing values, which amounts to about 21% of the observations. Most other columns involved in the Bootstrap Forest analysis also contain missing values. The Informative Missing option in the launch window ensures that the missing values are treated in a way that acknowledges any information that they carry. See Informative Missing in the Partition Models section.