Example of Compare Each Sample with Comparison Letters
This example uses the Consumer Preferences.jmp sample data table. This table contains survey data about people’s attitudes and opinions, as well as questions concerning oral hygiene. You explore the distribution of responses to the statement “I am working on my career” between each age group.
1. Select Help > Sample Data Library and open Consumer Preferences.jmp.
2. Select Analyze > Consumer Research > Categorical.
3. Select I am working on my career and click Responses on the Simple tab.
4. Select Age Group and click X, Grouping Category.
5. Click OK.
6. Click the Categorical red triangle and select Compare Each Sample.
Figure 3.26 Compare Each Sample
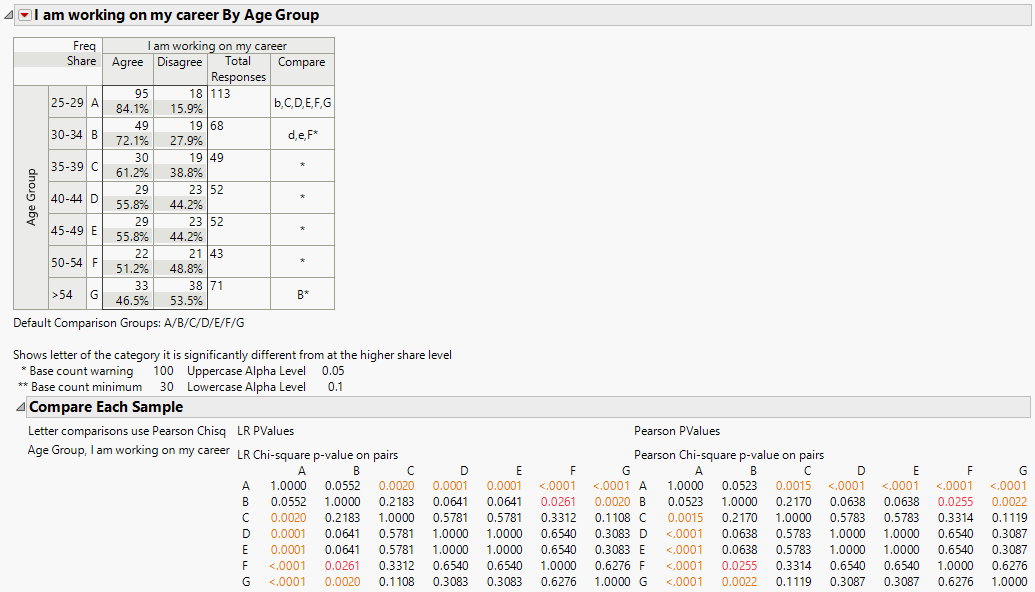
The crosstab table summarizes the statement “I am working on my career” across age groups. The cells of the table contain the frequency (count) and share (percent) of those who agree or disagree with the statement for each age group. In addition, the crosstab includes comparison letters. Each group is labeled with a letter in the Compare column, which is to the right of the group label. The letters in the Compare column enable you to interpret the outcomes of the statistical test of independence among groups.
The Compare Each Sample report provides p-values from the pairwise Pearson and Chi-square likelihood ratio chi-square tests. The p-values are reported in symmetric matrices labeled by the comparison letters.
For this example we make the following observations:
• The comparison column for the 25 - 29 group contains all letters b through g. Thus, the 25 - 29 group has significantly different response rates to the statement “I am working on my career” as compared to all other groups. Because the letter b is lowercase, the difference between the 25 - 29 group and the 30 - 34 group is significant at the 0.10 level. All other letters are uppercase, which indicate differences that are significant at the 0.05 level.
• The >54 group, denoted by letter G, is significantly different from the 30 - 34 group, denoted by B. The letter for the comparison is in the cell for group G because group G has a higher number of responders (71 versus 68) than group B.
• The single asterisks in the comparison cells are small sample size warnings. A single asterisk indicates that a group has more than 30 but fewer than 100 responses.
• A double asterisk, not observed in this example, would indicate a group size of fewer than 30.