Example of Creating a Dashboard with Two Reports
Suppose that you created two reports and want to run the reports again the next day against an updated set of data. This example shows how to create a dashboard from the reports in Dashboard Builder.
1. Select Help > Sample Data Library and open Hollywood Movies.jmp.
2. Run the table scripts named “Distribution: Profitability by Lead Studio and Genre” and “Graph Builder: World and Domestic Gross by Genre”.
3. From any window, select File > New > Dashboard.
Templates for common layouts appear.
4. Select the 2x1 Dashboard template.
A box with room for two reports appears on the workspace.
5. In the Reports list, double-click the report thumbnails to put them on the dashboard.
6. Click the Dashboard Builder red triangle and select Preview Mode.
A preview of the dashboard appears. Notice that the graphs are linked to each other and the data table. They also have the same red triangle options as the Distribution and Graph Builder platforms.
7. Click Close Preview.
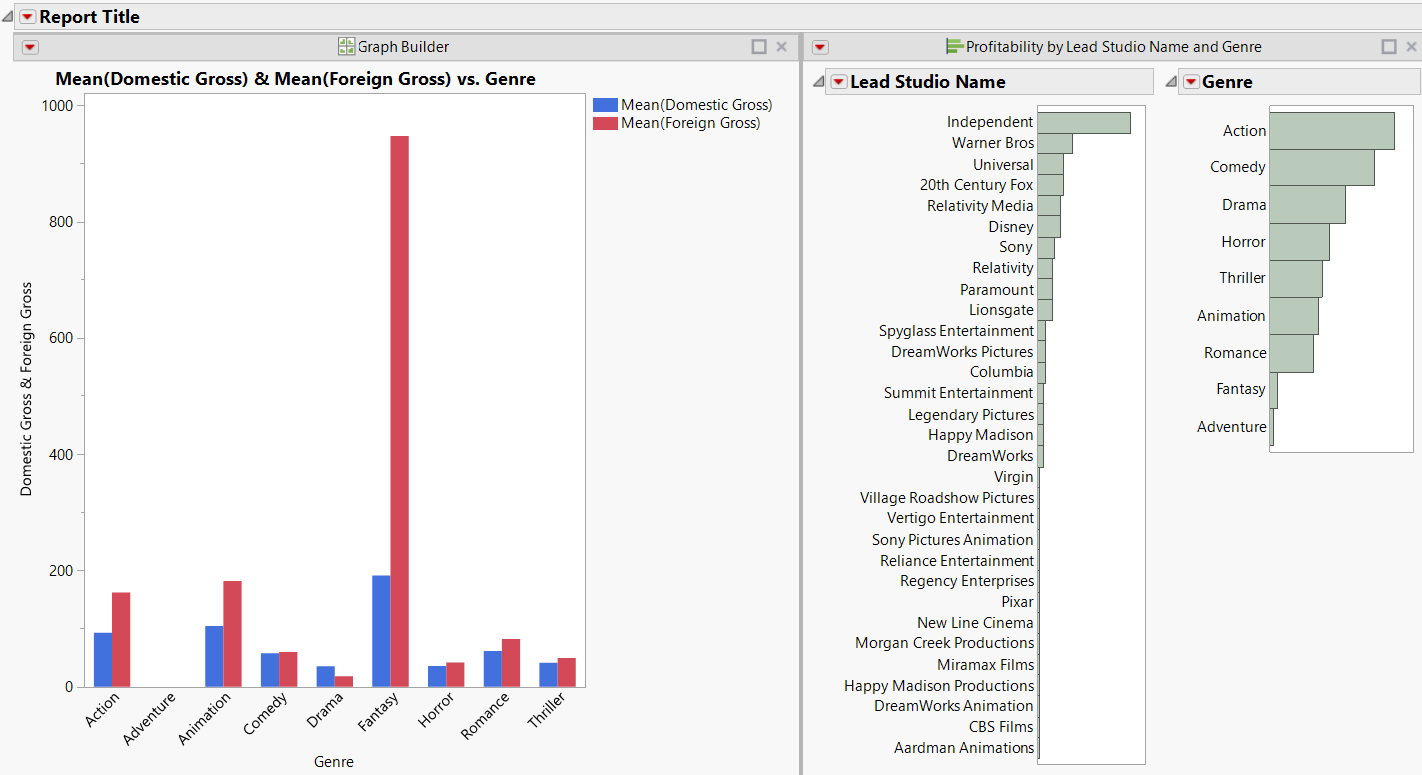
Figure 7.21 Dashboard with Two Reports
For more information about creating dashboards, see Extend JMP in Using JMP.