Example of Maximum Likelihood: Logistic Regression
This example shows how to use the Nonlinear platform to minimize a loss function. The loss function is the negative of a log-likelihood function, thus producing maximum likelihood estimates.
The Logistic w Loss.jmp data table in the Nonlinear Examples sample data folder has an example for fitting a logistic regression using a loss function. The Y column contains ones for events and zeros for non-events. The Model Y column has the linear model, and the Loss column has the loss function. In this example, the loss function is the negative log-likelihood for each observation, or the negative log of the probability of getting the observed response.
Run the model by following the steps below:
1. Select Help > Sample Data Library and open Nonlinear Examples/Logistic w Loss.jmp.
2. Select Analyze > Specialized Modeling > Nonlinear.
3. Assign Model Y to the X, Predictor Formula role.
4. Assign Loss to the Loss role.
Figure 14.11 Nonlinear Launch Window
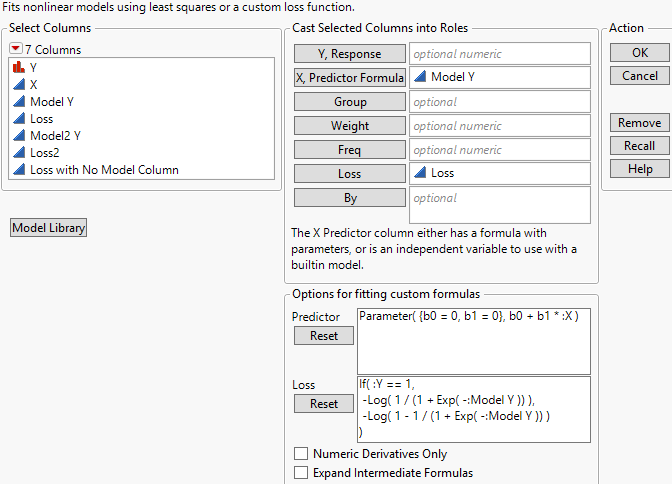
5. Click OK.
The Nonlinear Fit Control Panel appears.
Figure 14.12 Nonlinear Fit Control Panel
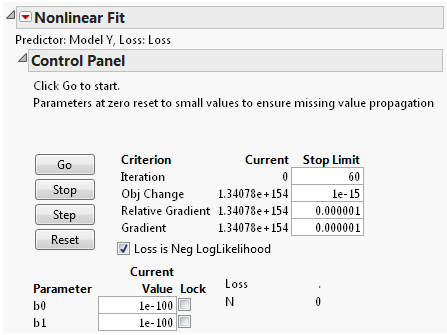
6. Click Go.
The parameter estimates are shown in the Solution report.
Figure 14.13 Solution Report
The Loss value in the Solution report is the negative log-likelihood evaluated at the parameter estimates.