Example of Multidimensional Scaling
This example uses the Flight Distances.jmp sample data table, which is a distance matrix of flight distances between 28 US cities. You can use MDS to construct a map of the cities in two dimensions that is based on the pairwise distances in the data table.
1. Select Help > Sample Data Library and open Flight Distances.jmp.
2. Select Analyze > Multivariate Methods > Multidimensional Scaling.
3. Select Birmingham through Washington DC and click Y, Columns.
Figure 10.2 Completed Multidimensional Scaling Launch Window
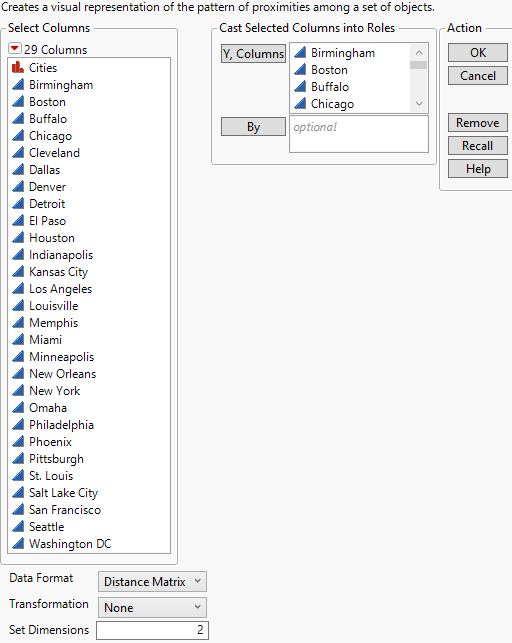
4. Click OK.
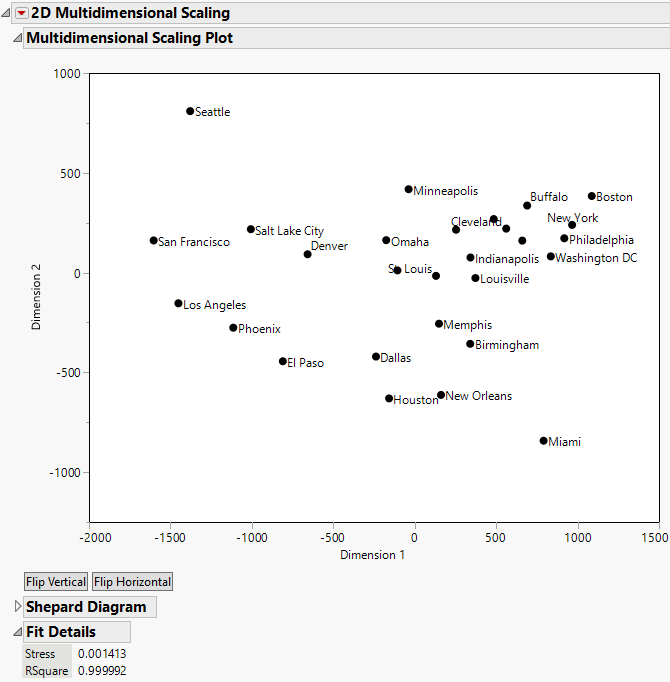
In the Multidimensional Scaling Plot, place your cursor over data points to view the row number or row label. The next 7 steps are to label and rotate your MSDS Plot.
5. Select the Flight Distances data table.
6. Right-click the column Cities and select Label/Unlabel.
7. Select Rows > Row Selection> Select all Rows.
8. Select Rows > Label/Unlabel.
9. Select the Multidimensional Scaling Plot.
10. Click the Flip Vertical button.
11. Click the Flip Horizontal button.
The Flip Vertical and Flip Horizontal buttons enable you to change the orientation of the MDS Plot. The MDS results are invariant to orientation. When the results have a known orientation, such as physical locations, then you might want to rotate or flip your plot.
Figure 10.3 Multidimensional Scaling Plot