Example of Oneway Analysis
This example uses the Analgesics.jmp sample data table. Thirty-three participants were administered three different types of analgesics (A, B, and C). The participants were asked to rate their pain levels on a sliding scale. You want to find out if the means for A, B, and C are significantly different.
1. Select Help > Sample Data Library and open Analgesics.jmp.
2. Select Analyze > Fit Y by X.
3. Select pain and click Y, Response.
4. Select drug and click X, Factor.
5. Click OK.
Figure 6.2 Example of Oneway Analysis
You notice that one drug (A) has consistently lower scores than the other drugs. You also notice that the x-axis ticks are unequally spaced. The length between the ticks is proportional to the number of scores (observations) for each drug.
Perform an analysis of variance on the data.
6. Click the red triangle next to Oneway Analysis of pain By drug and select Means/Anova.
Note: If the X factor has only two levels, the Means/Anova option appears as Means/Anova/Pooled t, and adds a Pooled t test report to the report window.
Figure 6.3 Example of the Means/Anova Option
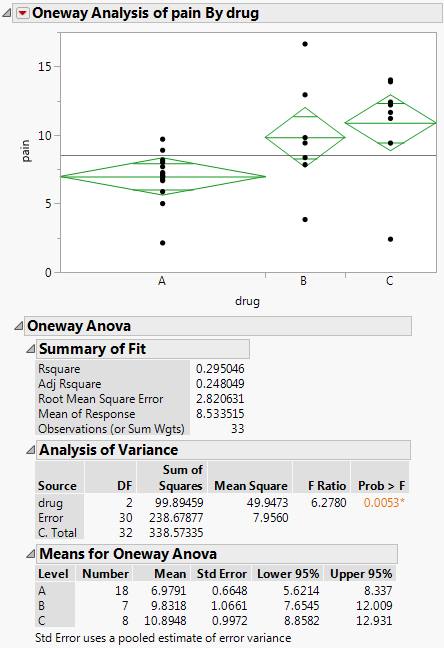
Note the following observations:
• Mean diamonds representing confidence intervals appear.
– The line near the center of each diamond represents the group mean. At a glance, you can see that the mean for each drug looks significantly different.
– The vertical span of each diamond represents the 95% confidence interval for the mean of each group.
See Mean Diamonds and X-Axis Proportional.
• The Summary of Fit table provides overall summary information about the analysis.
• The Analysis of Variance report shows the standard ANOVA information. You notice that the Prob > F (the p-value) is 0.0053, which supports your visual conclusion that there are significant differences between the drugs.
• The Means for Oneway Anova report shows the mean, sample size, and standard error for each level of the categorical factor.