Example of the Explore Patterns Utility
The Nicardipine Lab Patterns.jmp sample data table is adapted from a study of the drug Nicardipine. The data table contains 27 columns of numeric laboratory results. Use the Explore Patterns Utility to determine whether there are any unexpected patterns in the laboratory results.
1. Select Help > Sample Data Library and open the Nicardipine Lab Patterns.jmp sample data table.
2. Select Analyze > Screening > Explore Patterns.
3. Select the Laboratory Results column group and click Y, Columns.
4. Click OK.
5. Click the gray disclosure icon next to Univariate Summary to open the Univariate Summary report.
Figure 20.15 Explore Patterns Univariate Summary Report
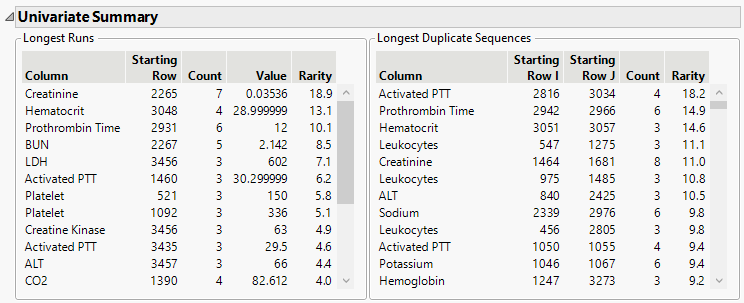
The Univariate Summary report summarizes the longest runs and longest duplicate sequences found across all of the columns. Each table is sorted by Rarity, a calculation of how likely the run or sequence is to occur by chance. The column with the highest rarity score for longest runs is Creatinine, whereas the column with the highest rarity score for longest duplicate sequences is Activated PTT. You will further examine these columns in the Univariate Patterns Report.
6. In the Univariate Patterns report, the report for the first column, Activated PTT, is shown initially. Hold down the Ctrl key and select Creatinine from the Select Columns list.
Figure 20.16 Explore Patterns Univariate Patterns Report
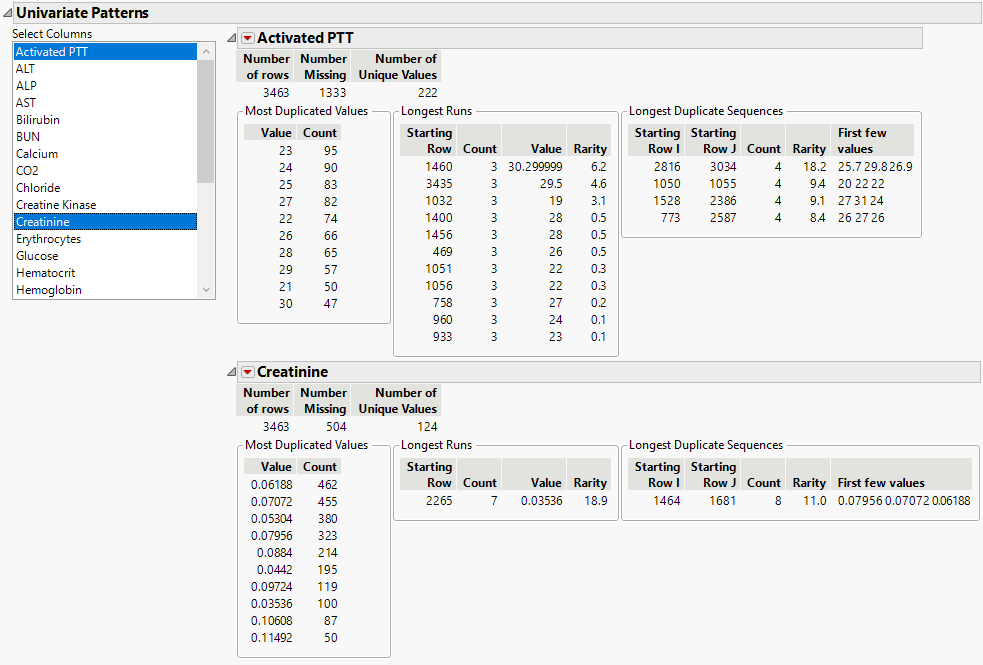
As you select column names from the Select Columns list, the corresponding column reports are shown. The Activated PTT report shows that this column contains several three count runs and four count sequences. The Creatinine report shows that although it is the column with the highest rarity score for Longest Runs, there is only one run in the column. This column also has one eight count sequence.