Example of the Fit Robust Command
The data in the Weight Measurements.jmp sample data table shows the height and weight measurements taken by 40 students.
1. Select Help > Sample Data Library and open Weight Measurements.jmp.
2. Select Analyze > Fit Y by X.
3. Select weight and click Y, Response.
4. Select height and click X, Factor.
5. Click OK.
6. Click the red triangle next to Bivariate Fit of weight By height and select Fit Line.
7. Click the red triangle next to Bivariate Fit of weight By height and select Robust > Fit Robust.
Figure 5.22 Example of Robust Fit
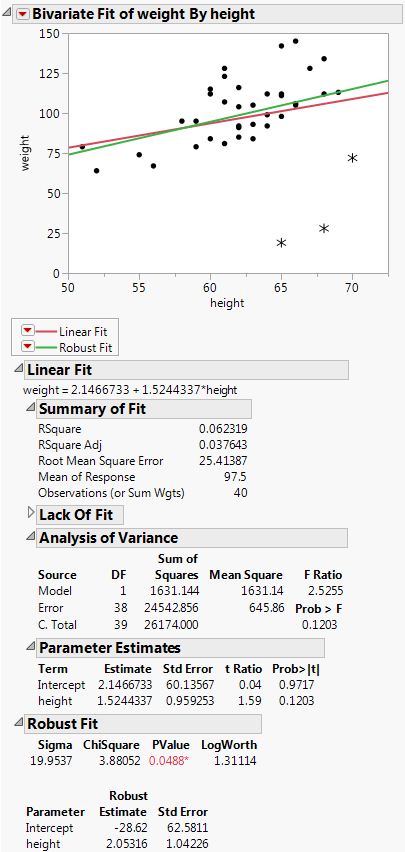
If you look at the standard Analysis of Variance report, you might wrongly conclude that height and weight do not have a linear relationship, since the p-value is 0.1203. However, when you look at the Robust Fit report, you would probably conclude that they do have a linear relationship, because the p-value there is 0.0489. It appears that some of the measurements are unusually low, perhaps due to incorrect user input. These measurements were unduly influencing the analysis.