Example of the Matching Column Option
This example uses the Matching.jmp sample data table, which contains data on six animals and the miles that they travel during different seasons.
1. Select Help > Sample Data Library and open Matching.jmp.
2. Select Analyze > Fit Y by X.
3. Select miles and click Y, Response.
4. Select season and click X, Factor.
5. Click OK.
6. Click the red triangle next to Oneway Analysis of miles By season and select Matching Column.
7. Select subject as the matching column.
8. Click OK.
Figure 6.37 Example of the Matching Column Report
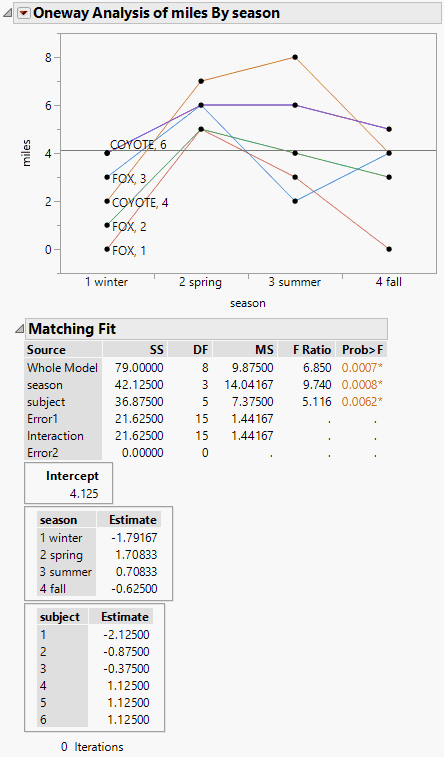
The plot graphs the miles traveled by season, with subject as the matching variable. The labels next to the first measurement for each subject on the graph are determined by the species and subject variables.
The Matching Fit report shows the season and subject effects with F tests. These are equivalent to the tests that you get with the Fit Model platform if you run two models, one with the interaction term and one without. If there are only two levels, then the F test is equivalent to the paired t test.
Note: For more information about the Fit Model platform, see Model Specification in Fitting Linear Models.