Example of the Multiple Response Test
This example uses the Consumer Preferences.jmp sample data table. This table contains data from a survey about people’s attitudes and opinions, as well as questions concerning oral hygiene. You can use the Test Multiple Response option to test if the response rates for each brushing time (Brush Delimited) are the same across groups (Brush). The groups are defined by the frequency that responders brush their teeth.
1. Select Help > Sample Data Library and open Consumer Preferences.jmp.
2. Scroll to the right until you see the Brush Delimited column.
Figure 3.19 Consumer Preferences Data Table
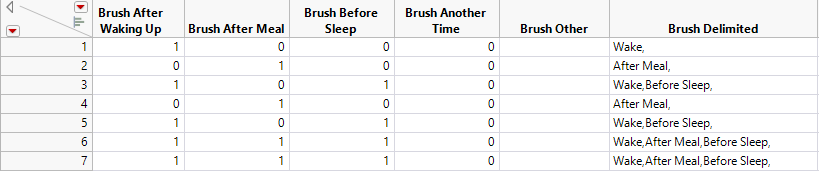
Note that the Brush Delimited column contains the responses to a multiple response question. Each response is separated by a comma. The four columns preceding Brush Delimited contain the same information in a different data format. Each column (Brush after Waking Up, Brush After Meal, Brush Before Sleep, and Brush Another Time) contains one response. If the response was selected the column value is a 1, and otherwise it is 0.
3. Select Analyze > Consumer Research > Categorical.
4. Select the Multiple tab.
5. Select Brush Delimited and click Multiple Delimited on the Multiple tab.
Tip: Alternatively, you can select Brush after Waking Up, Brush After Meal, Brush Before Sleep, and Brush Another Time and click Indicator Group on the Multiple tab
6. Select Brush and click X, Grouping Category.
7. Click OK.
8. Click the Categorical red triangle and select Test Multiple Response > Count Test, Poisson.
Figure 3.20 Test Multiple Response, Poisson
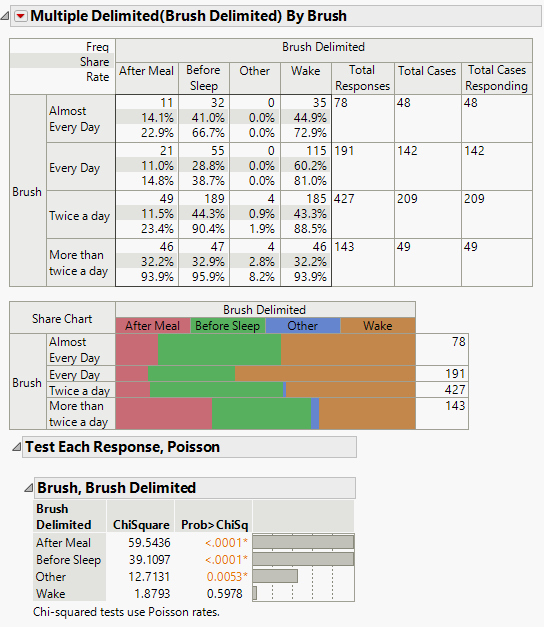
The p-values show that the response rates for After Meal, Before Sleep, and Other are significantly different across brushing groups.Wake is not significantly different across brushing groups. The bar graph to the right of the Prob>ChiSq column plots the p-values on a -Log10(p) scale. From the crosstab table, you can see that most people brush their teeth when they wake up regardless of how frequently they brush their teeth.
9. Click the Categorical red triangle and select Test Multiple Response > Homogeneity Test, Binomial.
Figure 3.21 Test Multiple Response, Binomial
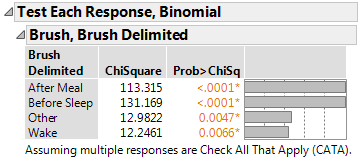
The Homogeneity Test, Binomial option always produces a larger test statistic (and therefore a smaller p-value) than the Count Test, Poisson option. The binomial distribution compares not only the rate at which the response occurred (the number of people who reported that they brush upon waking) but also the rate at which the response did not occur (the number of people who did not report that they brush upon waking).
In this example, the proportion of responders for each response (After Meal, Before Sleep, Wake, and Other) differs across the age groups. The p-value for each response is less than 0.05.
Tip: JMP detects a multiple response column by the Multiple Response modeling type or the Multiple Response column property.