Example of the Prediction Profiler
This example uses the Tiretread.jmp sample data table. There are three factors (SILICA, SILANE, and SULFUR) and four responses (ABRASION, MODULUS, ELONG, and HARDNESS). The goal is to find the optimal combination of the three factors in the development of a tire tread compound. See Derringer and Suich (1980).
1. Select Help > Sample Data Library and open Tiretread.jmp.
2. Select Graph > Profiler.
3. Select Pred Formula Abrasion and click Y, Prediction Formula.
Figure 3.2 Completed Prediction Profiler Launch Window
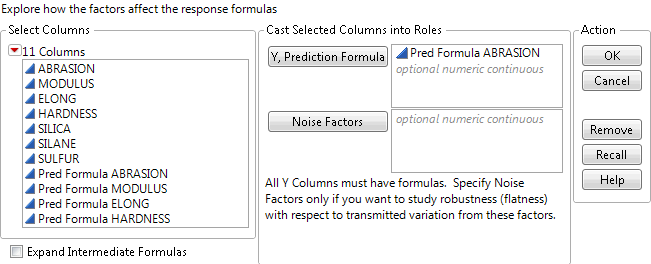
4. Click OK.
Figure 3.3 Prediction Profiler Report Window
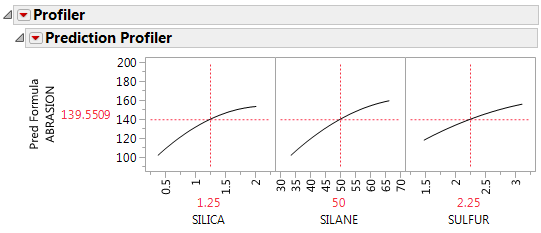
The profiler is interactive. The vertical red lines correspond to the current value of the factors. The current value of each factor is also shown in red below the horizontal axis. The red value on the vertical axis is the predicted response based on the current values of the factors. Click and drag the vertical red lines to change the current values of the factors. Click a factor’s red value to set the factor to a specific value.
5. Click the Prediction Profiler red triangle and select Optimize and Desirability > Desirability Functions.
6. Click the Prediction Profiler red triangle and select Optimize and Desirability > Maximize Desirability.
Tip: You might need to adjust the vertical axis of the prediction profiler to view the maximum value of ABRASION in the plot.
Figure 3.4 Maximize Desirability Report
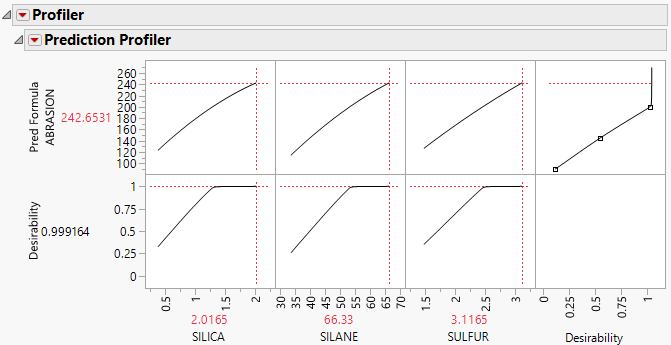
By maximizing the desirability, you see that to maximize ABRASION, all factors are set to their highest levels.