Fit Mixture Example
In this example, you fit two mixture distributions and then identify observations belonging to one of the clusters for the second mixture.
Fit Two Mixture Distributions
1. Select Help > Sample Data Library and open Reliability/Mixture Demo.jmp.
2. Select Analyze > Reliability and Survival > Life Distribution.
3. Select Y1 and click Y, Time to Event.
4. Click OK.
5. Click the Life Distribution red triangle and select Fit Mixture.
6. Type 2 in the Quantity box next to Weibull.
7. Select Separable Clusters in the Starting Value Methods panel.
8. Click Go.
Figure 3.20 Fit Mixture for Weibull (2)
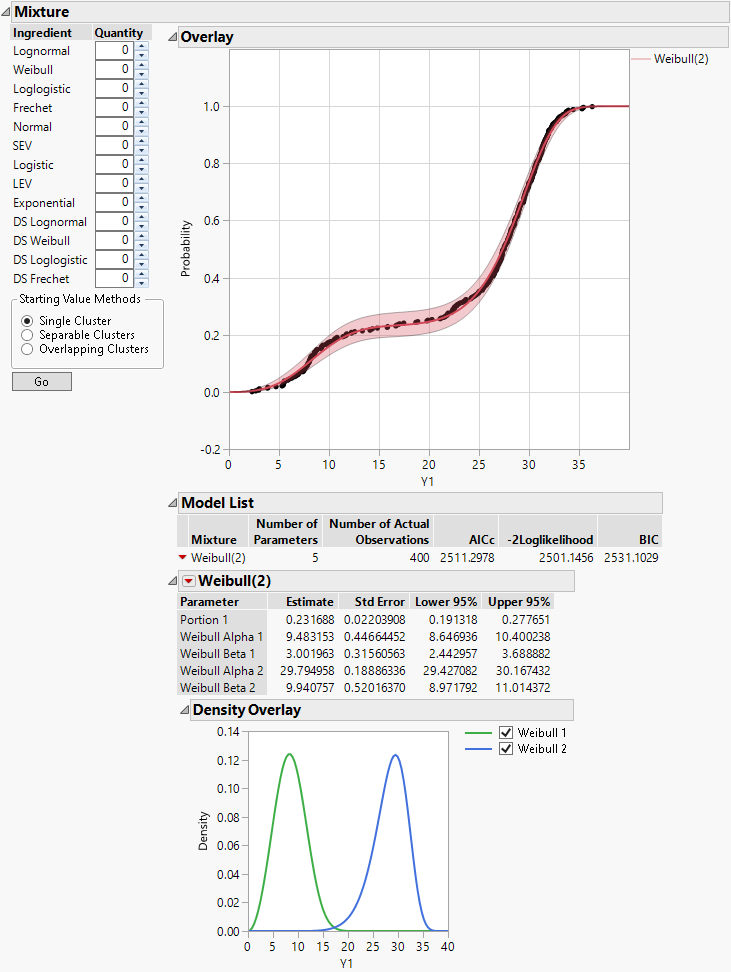
JMP fits a mixture model consisting of two Weibull components. Portion 1 is estimated as 0.231688, indicating that approximately 23% of observations have the Weibull distribution with alpha = 9.483153 and beta = 3.001963. The remaining 77% are estimated to come from the second Weibull distribution.
To compare this model to another, you can change the Ingredient selections and the Quantity of components.
9. Type 1 next to Lognormal and 1 next to Weibull.
10. Click Go.
Figure 3.21 Fit Mixture for Lognormal(1), Weibull(1)
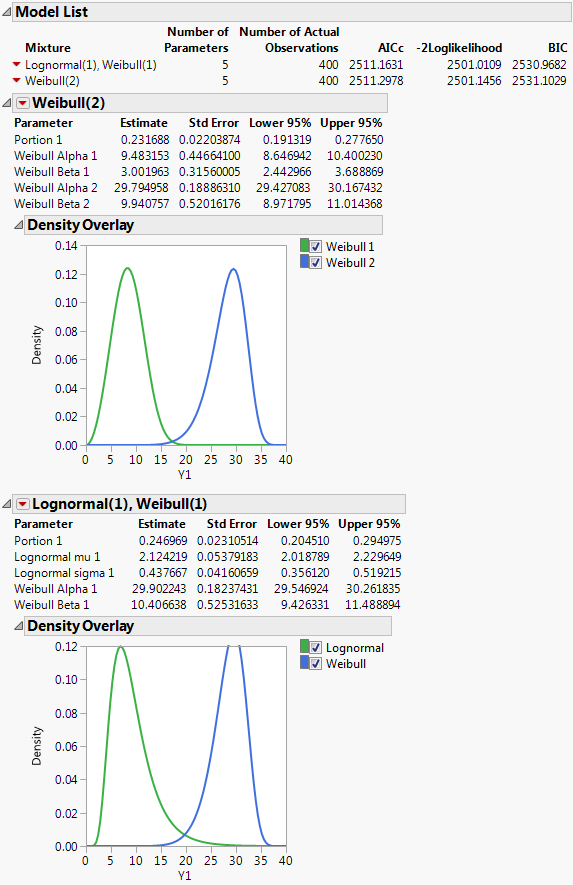
The Overlay plot is updated to show both mixture models. The plots and statistics in the Model List indicate that the Lognormal(1), Weibull(1) mixture seems to give a fit that is very similar to the Weibull(2) mixture.
Identify Observations Belonging to a Cluster
1. Click the red triangle next to Lognormal(1), Weibull(1) and select Save Predictions.
Two columns are added to the data table:
– Lognormal(1), Weibull(1) - Predicted Probability from Lognormal
– Lognormal(1), Weibull(1) - Predicted Probability from Weibull
2. Select Analyze > Distribution.
3. Select the two new columns from the Select Columns list and click Y, Columns.
4. Check Histograms Only.
5. Click OK.
6. In the histogram for Lognormal(1), Weibull(1) - Predicted Probability from Weibull, click in the bar corresponding to the value near 1.
Figure 3.22 Histograms for Mixture Probabilities
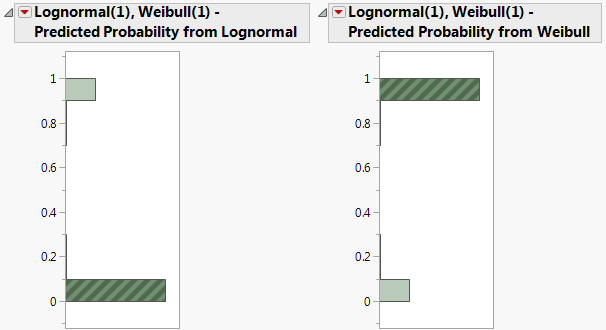
In the data table, the 297 corresponding rows are selected. These are the observations that are likely to have come from the Weibull distribution with parameters alpha = 29.90 and beta = 10.41.