Fitting Options
Each fitting option adds the following:
• a line, curve, or distribution to the scatterplot
• a red triangle menu to the report window
• a specific report to the report window
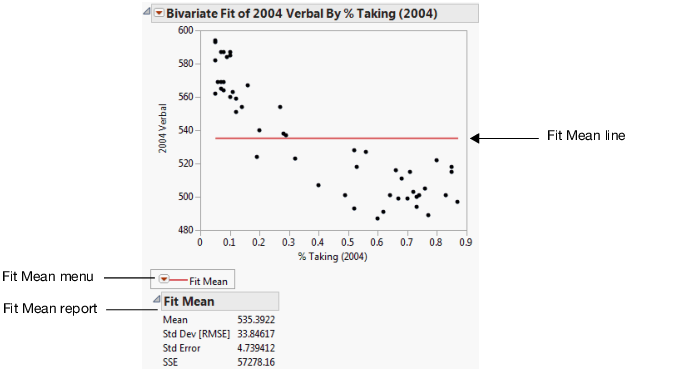
Figure 5.5 Example of the Fit Mean Option
The following fitting options are available:
Fit Mean
Adds a horizontal line to the scatterplot that represents the mean of the Y response variable. See Fit Mean.
Fit Line
Adds straight line fits to your scatterplot using least squares regression. See Fit Line and Fit Polynomial.
Fit Polynomial
Fits polynomial curves of a certain degree using least squares regression. See Fit Line and Fit Polynomial.
Fit Special
Transforms Y and X. Transformations include: log, square root, square, reciprocal, and exponential. You can also turn off center polynomials, constrain the intercept and the slope, and fit polynomial models. See Fit Special.
Flexible
Provides options that enable you to control the smoothness of the estimated regression curve. See Flexible.
Fit Orthogonal
Provides options for orthogonal regression fits, which are useful when X is assumed to vary. This option provides sub options that reflect various assumptions about the variances of X and Y. See Fit Orthogonal.
Robust
Provides options that reduce the influence of outliers in your data set on the fitted model. See Robust.
Density Ellipse
Plots density ellipsoids for the bivariate normal distribution fit to the X and Y variables. See Density Ellipse.
Nonpar Density
Plots density contours based on a smoothed surface. The contours describe the density of data points. See Nonpar Density.
Note: You can remove a fit using the Remove Fit option. See Fitting Menu Options.