Publication date: 04/30/2021
Graphics for Matched Pairs
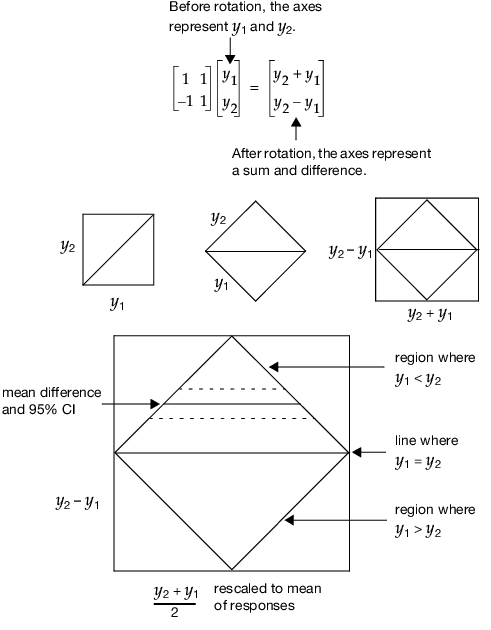
The primary graph in the platform is a Tukey mean-difference (Cleveland 1994, p. 130). This graph plots the difference of the two responses on the vertical axis against the mean of the two responses on the horizontal axis. This graph is the same as a scatterplot of the two original variables, but turned 45 degrees. A 45 degree rotation and rescaling turns the original coordinates into a difference and a mean.
Figure 19.6 Example of Transforming to Difference by Mean, Rotated by 45 Degrees
Want more information? Have questions? Get answers in the JMP User Community (community.jmp.com).