Launch the Response Screening Platform
Launch the Response Screening platform by selecting Analyze > Screening > Response Screening.
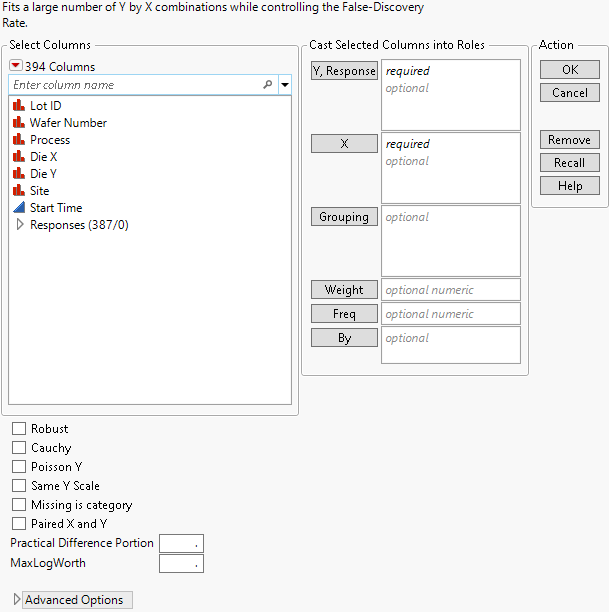
Figure 21.4 Response Screening Launch Window
For more information about the options in the Select Columns red triangle menu, see Column Filter Menu in Using JMP.
Launch Window Roles
Y, Response
Identifies the response columns containing the measurements to be analyzed.
X
Identifies the columns against which you want to test the responses.
Grouping
For each level of the specified column, analyzes the corresponding rows separately, but presents the results in a single table and report.
Weight
Identifies a column whose values assign a weight to each row. These values are used as weights in the analysis. See Weight in Fitting Linear Models.
Freq
Identifies a column whose values assign a frequency to each row. These values enable you to account for pre-summarized data. See Frequency in Fitting Linear Models.
By
For each level of the specified column, analyzes the corresponding Ys and Xs and presents the results in separate tables and reports.
Launch Window Options
Robust
For continuous responses, uses robust (Huber) estimation to down weight outliers. If there are no outliers, these estimates are close to the least squares estimates. Note that this option increases processing time.
Cauchy
Assumes that the errors have a Cauchy distribution. A Cauchy distribution has fatter tails than the normal distribution, resulting in a reduced emphasis on outliers. This option can be useful if you have a large proportion of outliers in your data. However, if your data are close to normal with only a few outliers, this option can lead to incorrect inferences. The Cauchy option estimates parameters using maximum likelihood and a Cauchy link function.
Poisson Y
Fits each Y response as a count having a Poisson distribution. The test is performed only for categorical X. This option is appropriate when your responses are counts.
Same Y Scale
Aligns all the Y responses to the same scale when you run individual analyses using the report’s Fit Selected Items options.
Missing is category
For any categorical X variable, treats missing values on X as a category.
Paired X and Y
Performs tests only for Y columns paired with X columns according to their order in the Y, Response and X lists. The first Y is paired with the first X, the second Y with the second X, and so on.
Practical Difference Portion
The fraction of the specification range, or of an estimated six standard deviation range, that represents a difference that you consider pragmatically meaningful. If Spec Limits is not set as a column property, a range of six standard deviations is estimated for the response. The standard deviation estimate is computed from the interquartile range (IQR), as 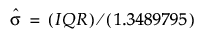 .
.
If no Practical Difference Proportion is specified, its value defaults to 0.10. Tests of practical significance and equivalence tests use this difference to determine the practical difference. See Compare Means Data Table.
MaxLogWorth
Use to control the scale of plots involving LogWorth values (-log10 of p-values). LogWorth values that exceed MaxLogWorth are plotted as MaxLogWorth to prevent extreme scales in LogWorth plots. See Example of the MaxLogWorth Option for an example.
Advanced Options
Contains the following options:
Kappa
Adds a new column called Kappa to the data table. If Y and X are both categorical and have the same levels, kappa is provided. This is a measure of agreement between Y and X.
Corr
The Corr option computes the Pearson product-moment correlation in terms of the indices defined by the value ordering.
If X and Y are both binary, the Pearson product-moment calculation gives Spearman’s rho and Kendall's Tau-b. Otherwise, a value of Corr that is large in magnitude indicates an association; a Corr value that is small in magnitude does not preclude an association.
Force X Categorical
Ignores the modeling type and treats all X columns as categorical.
Force X Continuous
Ignores the modeling type and treats all X columns as continuous.
Force Y Categorical
Ignores the modeling type and treats all Y columns as categorical.
Force Y Continuous
Ignores the modeling type and treats all Y columns as continuous.
Unthreaded
Suppresses multithreading.