Manage Spec Limits Utility
The Manage Spec Limits utility enables you to quickly add or edit many specification limits for several columns at once. The specification limits are then used in any future analyses. You can also specify importance values for each process and indicate if limits should appear in graphs as reference lines.
Example of the Manage Spec Limits Utility
1. Select Help > Sample Data Library and open Cities.jmp.
2. Select Analyze > Quality and Process > Manage Spec Limits.
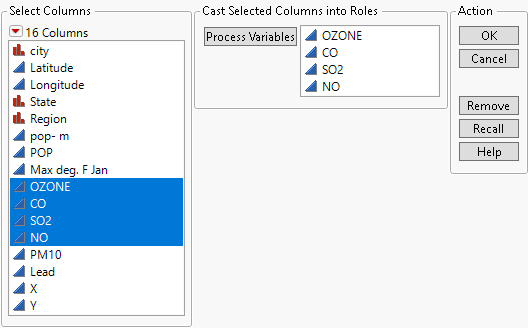
3. Specify the columns you want to set specification limits on. For this example, select OZONE, CO, SO2, and NO, and click Process Variables.
Figure A.1 Specify Columns
4. Click OK.
5. Add your specification limits. You can do this by loading existing limits from a JMP data table (Load from Limits Table) or by entering limits manually. For this example, enter the following limits manually:
– OZONE: LSL 0.12, USL 0.2
– CO: LSL 6, USL 12
– SO2: LSL 0.015, USL 0.06
– NO: LSL 0.02, USL 0.04
6. Click the red triangle next to Manage Spec Limits and select Show Limits All.
Specification limits for all columns will appear in graphs for any future analyses. If you want to show the specification limits only for individual columns, check the Show Limits box next to those columns.
Figure A.2 Set Specification Limits
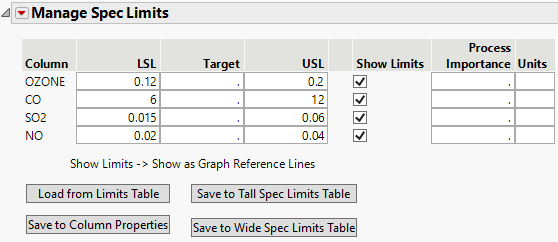
7. Choose how you want to save the specification limits. For this example, click Save to Column Properties. This saves them as column properties in the corresponding data table. You could also save them to a new data table (tall or wide format).
In the Cities.jmp data table Columns panel, notice that asterisks indicating the Spec Limits column property appear next to OZONE, CO, SO2, and NO.
8. To see values that are outside the limits in the data table, click the red triangle next to Manage Spec Limits and select Color Out of Spec Values. Go to the Cities.jmp data table, and you can see that any values that are outside the limits are now colored.
9. Now, you can run any analysis. For this example, select Analyze > Distribution.
10. Select OZONE, CO, SO2, and NO, and click Y, Columns.
11. Click OK.
Figure A.3 Specification Limits for OZONE in Distribution
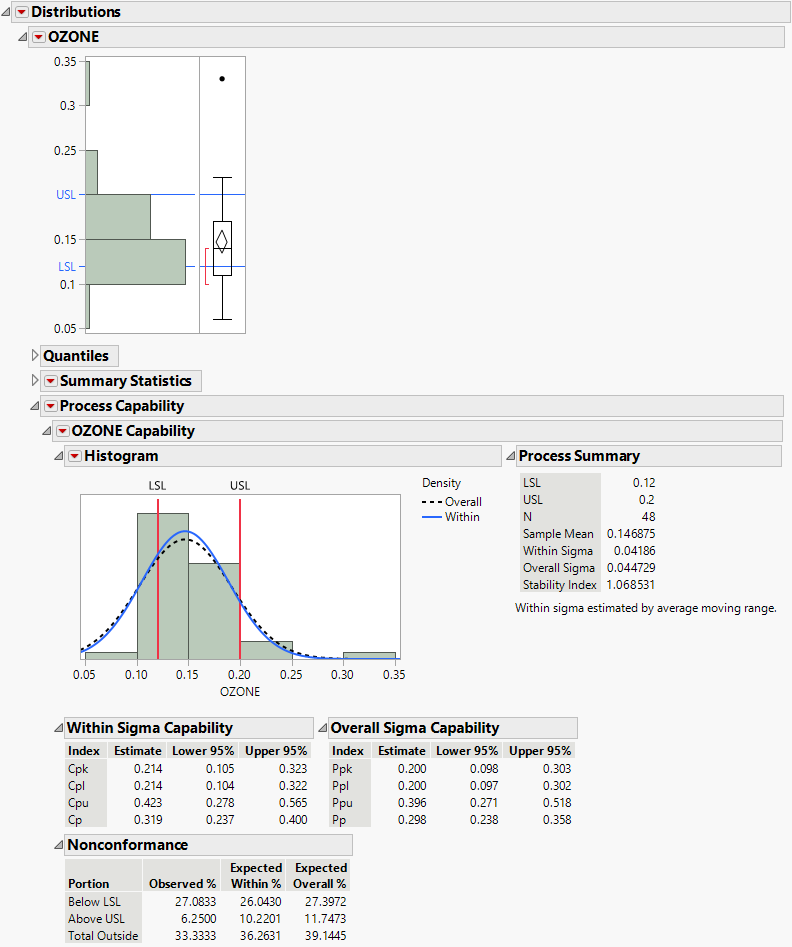
The specification limits that you added to the OZONE column appear in the histogram. Because the column contains a Spec Limits column property, the Distribution report also contains a Capability Analysis report.