Map Shapes
The Map Shapes element ![]() shows areas defined by the variable in the Map Shape zone.
shows areas defined by the variable in the Map Shape zone.
When a column in your data table contains the names of geographical regions (such as countries, states, provinces, counties), you can assign the column to the Map Shape zone. When a variable is dropped in the Map Shape zone, Graph Builder searches for internal maps that correspond to the values in the column. If it finds an appropriate map, it draws the map in the graph area.
Alternatively, you can define the Map Role column property for the column of interest. This property tells JMP how to connect the values in the column with map shape data. It is especially useful when you create custom maps. See Custom Map Files in the Maps section.
If you have a variable in the Map Shape zone, the X and Y zones disappear. You can add information from other variables using Color and Size.
• To color the map shapes by the values of a summary statistic, drag the column of interest to the Color zone. The categorical or continuous color theme selected in your Preferences is applied to each shape.
• To size the map shapes by the values of a summary statistic, drag the column of interest to the Size zone. This scales the map shapes according to the summary statistic value of the size variable, minimizing distortion.
See Maps. For examples, see Examples of Creating Maps in the Maps section, or run the associated scripts in these sample data tables: PopulationByMSA.jmp or SAT.jmp.
Figure 3.41 Map Shapes Options
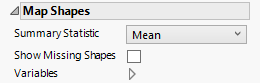
Summary Statistic
Changes the statistic that is plotted as the Color or Size variable.
Show Missing Shapes
Shows or hides missing data from the map.
Variables
Shows or hides graph elements for variables, or re-orders the display of variables.
Note: These options do not apply to variables in the Group X, Group Y, Wrap, or Page zones.
Check boxes are followed by the zone designation and the name of the variable. Use check boxes to do the following:
– Show or hide the elements corresponding to a variable in a zone.
– Add or remove the effect of applying the Color, Size, Shape, or Freq variable to the variable in the zone.
Tip: If you have multiple graphs, you can color or size each graph by different variables. Drag a second variable to the Color or Size zone, and drop it in a corner. In the Variables option, select the specific color or size variable to apply to each graph.
Use arrows to re-order the display if there are multiple variables in a zone. Highlight a variable name and click an arrow to reposition it.
For an example using Variables, see Example of an Area and Line Chart in the Graph Builder Examples section.