Publication date: 04/30/2021
Means Data Table
The Means data table contains a row for each combination of response and X level. For the Probe.jmp sample data table, there are 387 response variables, each tested against Process at two levels. The Means table contains 387x2 = 774 rows.
Figure 21.8 Means Data Table
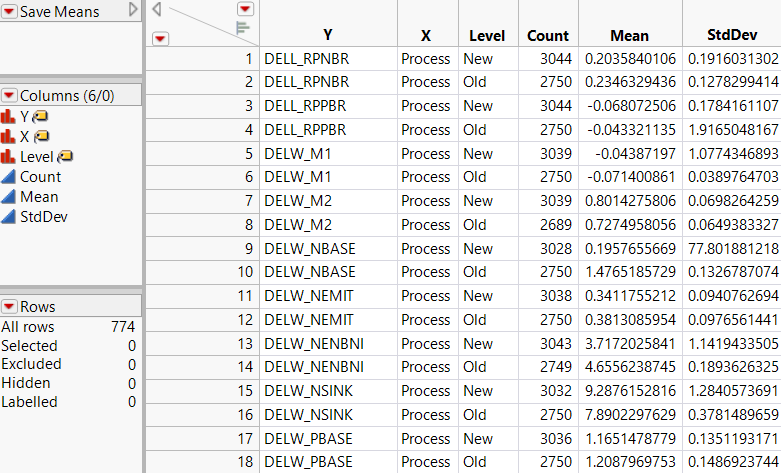
The Means data table includes the following columns:
Y
The continuous response variables.
X
The categorical variables.
Level
The level of the categorical X variable.
Count
The count of values in the corresponding Level.
Mean
The mean of the Y variable for the specified Level.
StdDev
The standard deviation of the Y variable for the specified Level.
Robust Mean
The robust M-estimate of the mean. Appears when you select the Robust option on the launch window.
Want more information? Have questions? Get answers in the JMP User Community (community.jmp.com).