P Chart Example
Note: When you generate a P chart and select Capability, JMP launches the Binomial Fit in Distribution and gives a Binomial-specific capability analysis.
The Washers.jmp data in the Quality Control sample data folder contains defect counts of 15 lots of 400 galvanized washers. The washers were inspected for finish defects such as rough galvanization and exposed steel. If a washer contained a finish defect, it was deemed nonconforming or defective. Thus, the defect count represents how many washers were defective for each lot of size 400. Using the Washers.jmp data table, specify a sample size variable, which would allow for varying sample sizes. This data contains all constant sample sizes.
1. Select Help > Sample Data Library and open Quality Control/Washers.jmp.
2. Select Analyze > Quality and Process > Legacy Control Charts > P.
3. Select # defective and click Process.
4. Select Lot and click Sample Label.
5. Select Lot Size and click Sample Size.
6. Click OK.
Figure 12.22 P Chart
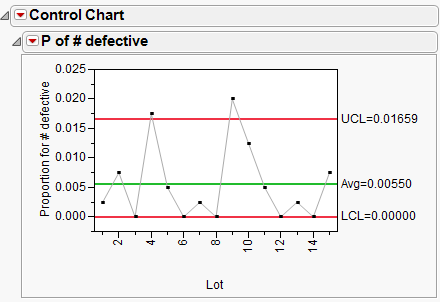
The P chart shows the proportion of defects. Note that although the points on the chart look the same as the NP chart in Figure 12.23, the vertical axis, Avg and limits are all different since they are now based on proportions.