Scatterplot Matrix
A scatterplot matrix is a collection of scatterplots organized into a grid (or matrix). Each scatterplot shows the relationship between a pair of variables.
Figure 4.14 Example of a Scatterplot Matrix
Scenario
This example uses the Solubility.jmp data table, which contains data for solubility measurements for 72 different solutes.
A lab technician wants to explore the following questions:
• Is there a relationship between any pair of chemicals? (There are six possible pairs.)
• Which pair has the strongest relationship?
To answer these questions, use a scatterplot matrix of the four solvents.
Create the Scatterplot Matrix
1. Select Help > Sample Data Library and open Solubility.jmp.
2. Select Graph > Scatterplot Matrix.
3. Select Ether, Chloroform, Benzene, and Hexane, and click Y, Columns.
Figure 4.15 Scatterplot Matrix Window
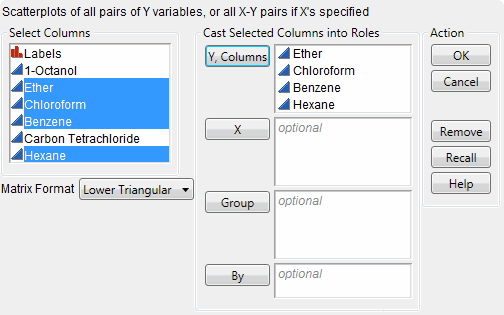
4. Click OK.
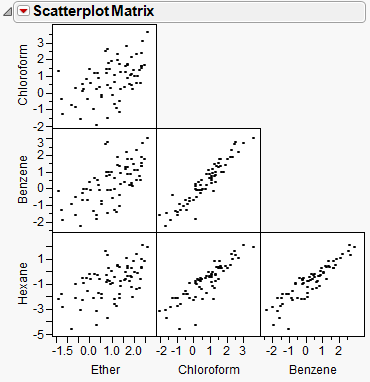
Figure 4.16 Scatterplot Matrix
Interpret the Scatterplot Matrix
The scatterplot matrix provides these answers:
• All six pairs of variables are positively correlated.
As one variable increases, the other variable increases too.
• The strongest relationship appears to be between Benzene and Chloroform.
The data points in the scatterplot for Benzene and Chloroform are the most tightly clustered along an imaginary line.
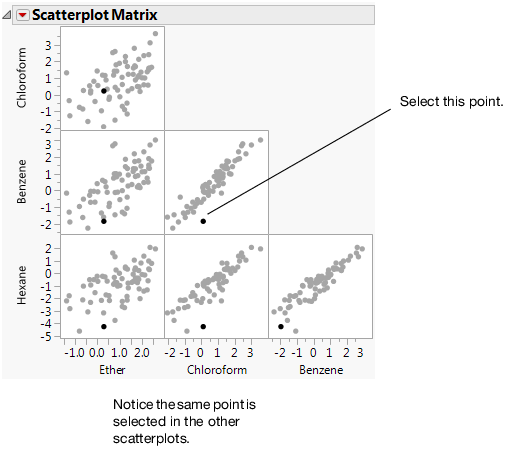
Interact with the Scatterplot Matrix
If you select a point in one scatterplot, it is selected in all the other scatterplots.
For example, if you select a point in the Benzene versus Chloroform scatterplot, the same point is selected in the other five plots.
Figure 4.17 Selected Points