Sheet or Surface Properties
If you have selected the Sheet, points option in the Appearance Controls, you can right-click the sheet inside the plot and select Sheet Properties to reveal a window that enables you to change the sheet properties. If you are plotting an Isosurface, right-click the surface and select Surface Properties to reveal a similar window. The Sheet Properties and Surface Properties windows enable you to modify the appearance of the surface plot, including the surface color, opacity, and contours. You can also show or hide a mesh that appears on the surface plot.
Figure 5.12 Sheet Properties Window
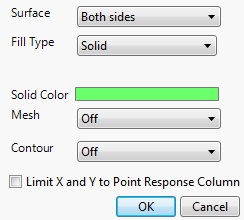
Surface
Enables you to show or hide the top or bottom of a surface. If Above only or Below only is selected, the opposite side of the surface is darkened.
Fill Type
Enables you to color the surface using a solid color, or continuous or discrete gradients.
Solid Color
(Available only when Solid is selected for Fill Type.) Enables you to choose a color for the surface.
Surface Fill
(Available only when a gradient is selected for Fill Type.) Specifies the dependent variable’s surface to which the fill type is applied. When Continuous Gradients is selected for Fill Type, you can also choose the Custom option for Surface Fill.
Custom
(Available only when Continuous Gradients is selected for Fill Type and when Custom is selected for Surface Fill.) Enables you to specify an equation that defines a response value. This equation is specified using JSL and can refer to columns in the data table using column scoping.
Surface Color Theme
(Available only when a gradient is selected for Fill Type.) Enables you to change the color theme for the surface or define a custom color theme. For more information about color themes, see Enter and Edit Data in Using JMP.
Gradient Levels
(Available only when Discrete Gradients is selected for Fill Type.) Enables you to specify the number of different colors used on the surface plot.
Surface Color Range
(Available only when a gradient is selected for Fill Type.) Enables you to choose the endpoints for the color gradient. If you choose Data, the endpoints of the color gradient are determined by the range of the data in the column selected for Surface. If you choose Axis, the endpoints of the color gradient are determined by the range of the axis for the dependent variable.
Caution: If you choose Axis for Surface Color Range and change the endpoints of the axis in the surface plot, the cutoff values for the color gradient change as well.
Lighting
Enables you to change the lighting of the surface plot. Choose between None, Low Reflection, and Normal.
Mesh
Enables you to turn on or off a surface mesh, for either the X or Y directions or both.
Mesh Color
(Available only when a value other than Off is selected for Mesh.) Enables you to select the color for the surface mesh.
Contour
Enables you to turn on or off a contour grid, either above, below, or on the surface. If turned on, the Contour Color option is revealed enabling you to change the color.
Contour Color
(Available only when a value other than Off is selected for Contour.) Enables you to select the color for the contour grid.
Limit X and Y to Point Response Column
Enables you to limit the range of the plot to the range of the data in the Point Response Column, if one is activated. If checked, this option essentially restricts the plot from extrapolating outside the range of the data in the Point Response Column.
Note: The equivalent JSL command for this option is Clip Sheet( Boolean ). You can send this message to a particular response column by appending the number of the response column. For example, Clip Sheet2( 1 ) limits the range of the plot to the range of the data of the second response column. See the Scripting Index in the JMP Help menu for an example.