Spectral Density Report
Figure 17.15 Spectral Density Plots and White Noise Test Report
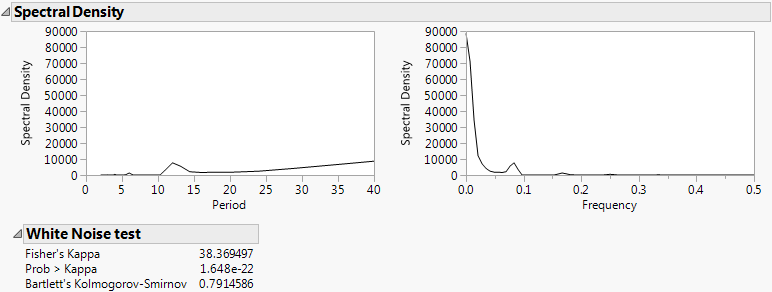
The White Noise Test report contains the following statistics:
Fisher’s Kappa
Tests the null hypothesis that the values in the series are drawn from a normal distribution with variance 1 against the alternative hypothesis that the series has a periodic component. Kappa is the ratio of the maximum value of the periodogram, I(fi), and its average value.
Prob > Kappa
The probability of observing a value larger than Kappa if the null hypothesis is true, given by the following equation:
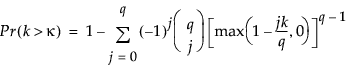
where
q = N / 2 if N is even, q = (N - 1) / 2 if N is odd
κ is the observed value of Kappa
The null hypothesis is rejected if this probability is less than the significance level α.
Bartlett’s Kolmogorov-Smirnov
Compares the normalized cumulative periodogram to the cumulative distribution function of the uniform distribution on the interval (0, 1). The test statistic equals the maximum absolute difference of the cumulative periodogram and the uniform CDF. If it exceeds  , then one typically rejects the hypothesis that the series comes from a normal distribution. The values a = 1.36 and a = 1.63 correspond to significance levels 5% and 1% respectively.