Statistical Details for Attribute Gauge Charts
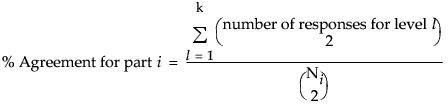
For the first chart in Figure 6.5 that plots all X, Grouping variables on the x-axis, the percent Agreement is calculated as follows:
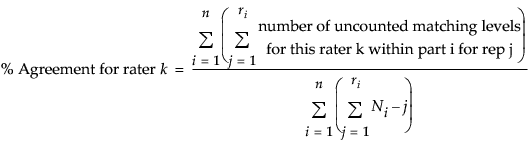
For the second chart in Figure 6.5 that plots all Y, Response variables on the x-axis, the percent Agreement is calculated as follows:
Note the following:
• n = number of parts (grouping variables)
• ri = number of reps for part i (i = 1,...,n)
• m = number of raters
• k = number of levels
• Ni = m x ri. Number of ratings on part i (i = 1,...,n). This includes responses for all raters, and repeat ratings on a part. For example, if part i is measured 3 times by each of 3 raters, then Ni is 3 x 3 = 9.
For example, consider the following table of data for three raters, each having three replicates for one part.
| A | B | C |
|---|---|---|---|
1 | 1 | 1 | 1 |
2 | 1 | 1 | 0 |
3 | 0 | 0 | 0 |
Using this table, you can make these calculations:
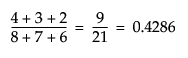
% Agreement =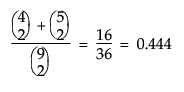
% Agreement [rater A] = percent Agreement [rater B] = 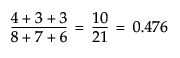 and
and
% Agreement [rater C] =