The Fit Curve Report
The Fit Curve report initially contains only a plot of Y versus X. If you specify a Group variable, the report includes overlaid and individual plots for each group of the fitted model.
Figure 13.7 Fit Curve Reports: No Grouping Variable (left) and with Group Variable (right)
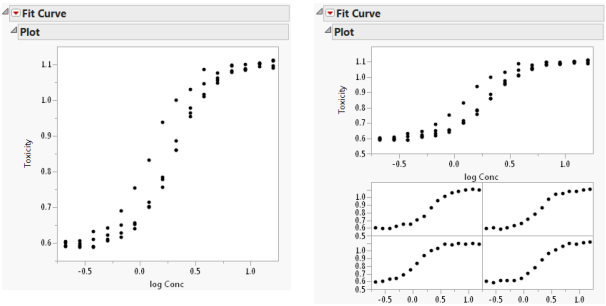
After fitting a model, the fitted model appears on the plot (when no grouping variable is specified on the platform launch window). A Model Comparison report appears above the plots and a Model Report appears below the plot. Each time a new model is fit, it appears in the Model Comparison report and a new model report appears in the report window. See Model Comparison Report and Model Fit Report.
Note: Any rows that are excluded in the data table are also hidden in the Fit Curve plot.