The Treemap Window
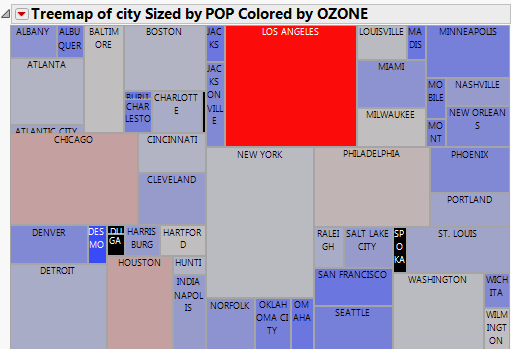
Figure A.2 The Treemap Window
Tip: To zoom in on the treemap, use the Magnifier tool or press the Z key.
Treemap rectangles can have the following attributes:
• Categories add labels to the rectangles. You can specify one or two categories. You can show or hide labels using the Show Labels option. See Treemap Right-Click Menu.
• Rectangle size is determined by one of the following:
– The Sizes variable, if you specify one.
– If you do not specify a Sizes variable, size is determined by the frequency of the category.
• Rectangle color is determined by one of the following:
– If the variable is continuous, the colors are based on a continuous color theme setting. The default color theme is Blue to Gray to Red. The color of each value is based on the average value of all of the rows. Blue represents the lowest values, and red represents the highest values. The color is most intense at the extremes of the variable, and paler colors correspond to levels that are close to the mean.
– If the variable is categorical, the colors are based on a categorical color theme. The default color theme is JMP Default.
– If you do not specify a Coloring variable, colors are chosen from a rotating color theme.
– If you have used the Value Colors column property to color a column, that property determines the colors of the categories.
• The order of the rectangles is determined by one of the following:
– The Ordering variable, if you specify one.
– If you do not specify an Ordering variable, the order is alphabetical by default. Values progress from the top left to the lower right.