Publication date: 04/30/2021
Time Series Graph
The Time Series graph plots each times series by the time ID. If no time ID is specified, the row number is used instead. The platform also performs several tests for stationarity using Augmented Dickey-Fuller (ADF) tests. The following tests and summary statistics are displayed next to the time series graph:
Mean
The sample mean.
SD
The sample standard deviation.
N
The series length.
Zero Mean ADF
A test against a random walk with zero mean, which is defined as follows:
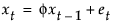
Single Mean ADF
A test against a random walk with a non-zero mean, which is defined as follows:
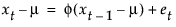
Trend ADF
A test against a random walk with a non-zero mean and a linear trend, which is defined as follows:

Want more information? Have questions? Get answers in the JMP User Community (community.jmp.com).