Value Order Example
Suppose that you want the values for a factor to appear in a different order in the Prediction Profiler. Consider an example of a wine tasting experiment, constructed using Custom Design. Wine is rated by five experts, each listed as a Rater in the Wine Data.jmp sample data table. Rater is a fixed blocking factor. Nine factors are studied. Rating is the response.
1. Select Help > Sample Data Library and open Design Experiment/Wine Data.jmp.
2. In the Table panel, click the green triangle next to the Reduced Model script.
3. Click Run.
The Prediction Profiler appears at the bottom of the report.
Figure A.29 Profiler with Original Value Order
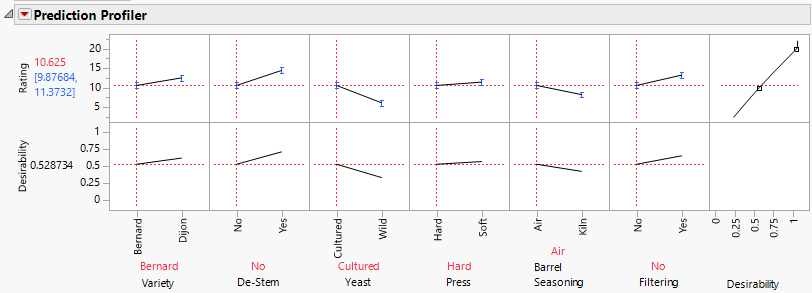
Notice that the values for De-Stem and Filtering appear in the order No followed by Yes. You want to reverse these, so that the Yes level appears first.
Tip: To arrange the profiler click the Prediction Profiler red triangle and select Appearance > Arrange in rows. For this example enter 7 and click OK.
4. Close the Response Rating report.
5. In the data table, click the asterisk next to De-Stem in the columns panel and select Value Order.
6. Click Reverse.
7. Click OK.
8. Click the asterisk next to Filtering in the columns panel and select Value Order.
9. Click Reverse.
10. Click OK.
11. Again, click the green triangle next to the Reduced Model script.
12. Click Run.
Figure A.30 Profiler with New Value Orders
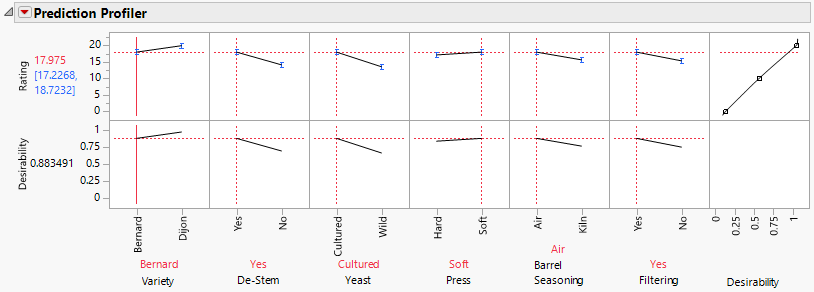
The levels for De-Stem and Filtering now appear in the order Yes followed by No.
13. Close the Wine Data.jmp sample data table without saving the changes.