Publication date: 04/30/2021
Variable Importance Plot
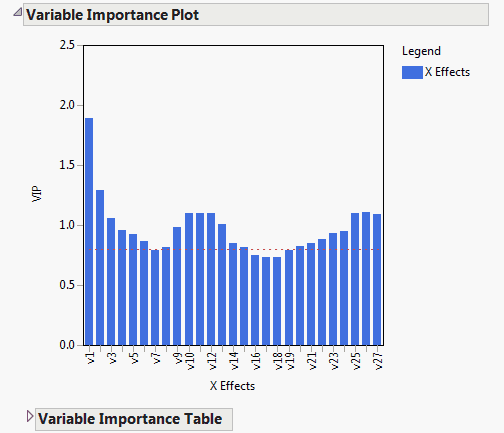
The Variable Importance Plot graphs the VIP values for each X variable. The Variable Importance Table shows the VIP scores. A VIP score is a measure of a variable’s importance in modeling both X and Y. If a variable has a small coefficient and a small VIP, then it is a candidate for deletion from the model (Wold 1994). A value of 0.8 is generally considered to be a small VIP (Eriksson et al. 2006) and a red dashed line is drawn on the plot at 0.8.
Figure 6.12 Variable Importance Plot
Want more information? Have questions? Get answers in the JMP User Community (community.jmp.com).
